Management's Discussion
and Analysis
Financial Statements
and Notes
1303 East Algonquin Road
Schaumburg, Illinois 60196
March
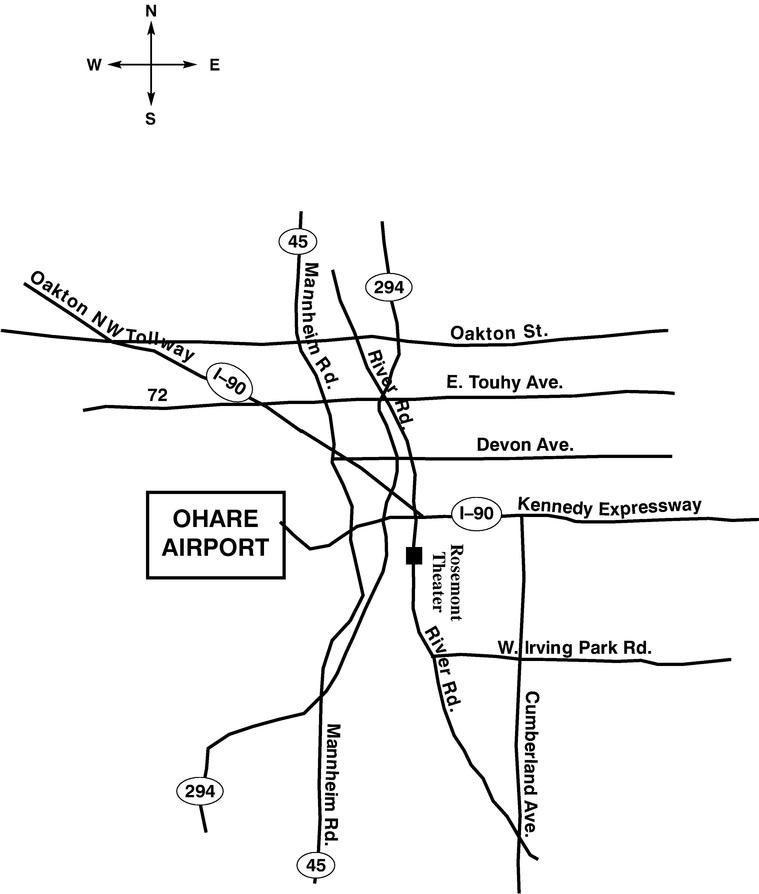
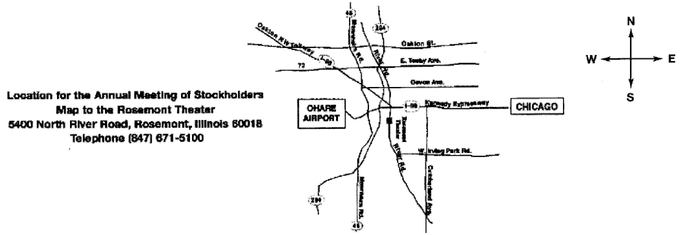
Rosemont Theater
5400 N. River Road
Rosemont, Illinois 60018
SCHEDULE 14A INFORMATION
Proxy Statement Pursuant to Section 14(a) of
the Securities Exchange Act of 1934 (Amendment No. )
| Filed by the Registrantý | ||
| Filed by a Party other than the Registranto | ||
Check the appropriate box: | ||
| o | Preliminary Proxy Statement | |
| o | Confidential, for Use of the Commission Only (as permitted by Rule 14a-6(e)(2)) | |
| ý | Definitive Proxy Statement | |
| o | Definitive Additional Materials | |
| o | Soliciting Material Pursuant to §240.14a-12 | |
MOTOROLA, INC. | ||||
(Name of Registrant as Specified In Its Charter) | ||||
(Name of Person(s) Filing Proxy Statement, if other than the Registrant) | ||||
| Payment of Filing Fee (Check the appropriate box): | ||||
| ý | No fee required | |||
| o | Fee computed on table below per Exchange Act Rules 14a-6(i)(4) and 0-11 | |||
| (1) | Title of each class of securities to which transaction applies: | |||
| (2) | Aggregate number of securities to which transaction applies: | |||
| (3) | Per unit price or other underlying value of transaction computed pursuant to Exchange Act Rule 0-11 (set forth the amount on which the filing fee is calculated and state how it was determined): | |||
| (4) | Proposed maximum aggregate value of transaction: | |||
| (5) | Total fee paid: | |||
| o | Fee paid previously with preliminary materials. | |||
| o | Check box if any part of the fee is offset as provided by Exchange Act Rule 0-11(a)(2) and identify the filing for which the offsetting fee was paid previously. Identify the previous filing by registration statement number, or the Form or Schedule and the date of its filing. | |||
| (1) | Amount Previously Paid: | |||
| (2) | Form, Schedule or Registration Statement No.: | |||
| (3) | Filing Party: | |||
| (4) | Date Filed: | |||
| ||
| Proxy Statement | ||
Management's Discussion and Analysis | ||
Financial Statements and Notes | ||
| PRINCIPAL EXECUTIVE OFFICES: 1303 East Algonquin Road Schaumburg, Illinois 60196 March | PLACE OF MEETING: Rosemont Theater 5400 N. River Road Rosemont, Illinois 60018 | |
NOTICE OF ANNUAL MEETING OF STOCKHOLDERS
To the Stockholders:
Our Annual Meeting will be held at the Rosemont Theater, 5400 N. River Road, Rosemont, Illinois 60018 on Monday, May 6, 20025, 2003 at 5:00 P.M., local time.
The purpose of the meeting is to:
Only Motorola stockholders of record at the close of business on March 15, 200214, 2003 will be entitled to vote at the meeting. Please vote in one of the following ways:
PLEASE NOTE THAT ATTENDANCE AT THE MEETING WILL BE LIMITED TO STOCKHOLDERS OF MOTOROLA AS OF THE RECORD DATE (OR THEIR AUTHORIZED REPRESENTATIVES) HOLDING ADMISSION TICKETS OR OTHER EVIDENCE OF OWNERSHIP. THE ADMISSION TICKET IS DETACHABLE FROM YOUR PROXY CARD. IF YOUR SHARES ARE HELD BY A BANK OR BROKER, PLEASE BRING TO THE MEETING YOUR BANK OR BROKER STATEMENT EVIDENCING YOUR BENEFICIAL OWNERSHIP OF MOTOROLA STOCK TO GAIN ADMISSION TO THE MEETING.
| By order of the Board of Directors, | ||
A. Peter Lawson Secretary |
Christopher B. GalvinChairman of the Board andChief Executive Officer
March 29, 200227, 2003
Dear Fellow Stockholders:
2001 was a tougher year than any other in the history of Motorola. Like others, we inopportunely chased the dot-com and telecom boom in 2000. We built-up manufacturing capacity and a global cost structure anticipating $45 billion in sales in 2001, having achieved $37.6 billion in sales in 2000. Unfortunately, given the severe downturn in telecom markets, dramatic fall off in semiconductor demand and horrific world events during 2001, our actual global sales were approximately $30 billion. Consequently, our major management focus was aggressively directed to reversing the impact of 2001 and returning to profitability.
We find our financial performance as unacceptable as our stockholders do. We've taken the tough, necessary steps to improve our cost structure, institute new efficiencies across the corporation and enhance our balance sheet. We enter 2002 as a leaner, more agile, more focused and more fiscally sound company. We intend to remain focused on our new course of action to enhance the shareholder value of this great company. I thank you for your continued support of Motorola through these trying times.
At the same time, weYou are committed to our key beliefs—uncompromising integrity and constant respect for people. Our company was built on these key beliefs and they fundamentally dictate the way we do business. We will continue to be transparent about our performance and we will continue to provide financial statements and other information that fully and accurately describe the condition of our company and the risks and opportunities that face our businesses.
You arecordially invited to attend the 2002Motorola's 2003 Annual Meeting of Stockholders to be held on Monday, May 6,5, 2003, in Rosemont, Illinois. I look forward to our Annual Meeting each year because it gives me a chance to report to you on our progress during the last year. In 2002, during the middle phase of our turnaround, we exceeded the vast majority of the financial metrics we set out to achieve. Most importantly, in the second half of 2002 we returned Motorola to profitability, even in the face of declining sales. Despite these achievements, we are not satisfied. I will report on the last phase of our turnaround at the meeting, as well as hear your questions and concerns.
In 2003, we are also celebrating an important landmark in Motorola's history—the 75th anniversary of our founding. In 1928, we incorporated with $565 in cash, $750 in tools and a design for our first product. Today, we enter our 75th year as a technology leader. We are helping to build a global society unimagined by our founders, guided by high ethics and principles and executing a forward-looking plan to help us outperform our competitors, generate profit and cash and drive growth.
At this year's Annual Meeting, in addition to electing the 13 members of our Board of Directors, we are asking our shareholders to consider two important proposals for our 2002 Annual Meeting. First, we are asking for your approval ofapprove the Motorola Omnibus Incentive Plan of 2002. The use of stock options and other stock awards to compensate employees remains widely prevalent among technology companies.2003. The Board has adopted the 20022003 Plan in order to maintain the flexibility we need to keep pace with our competitors and to effectively recruit, motivate and retain the caliber of employees essential for our company'sCompany's success. The 2002 Plan isuse of stock options and other stock awards to compensate employees remains integral to Motorola's compensation strategies and programs in 2002programs. Stock options and going forward.
Weother stock awards are also asking for your approvalissued to a wide range of an amendmentmanagerial and individual contributors throughout the Company and all over the world to encourage employees to further align their personal financial worth to the Company's share price growth. During 2002, more than 44,000 employees received Motorola Employee Stock Purchase Planstock options. This means our stock incentive plans are used to motivate almost half of 1999 to make 50 million additional shares available for purchase byour employees. The Employee Stock Purchase Plan continues to be an important tool in a very competitive employment market. It also encourages employees to own more shares of Motorola and thereby further aligns their interests with those of our stockholders.
Each of these proposalsproposal is discussed in greater detail in the enclosed Proxy Statement.
I encourage each of you to vote your shares through one of the three convenient methods described in the enclosed Proxy Statement. I would appreciate your support of these proposalsthe nominated directors and the proposal to approve the Motorola Omnibus Incentive Plan of 2003 and, as always, I thank you for your continued support of Motorola.
Very truly yours,


Christopher B. Galvin
Chairman of the Board
and Chief Executive Officer
TABLE OF CONTENTS
PROXY STATEMENT
| | PAGE | ||
|---|---|---|---|
| • Voting Procedures | 1 | ||
| • Who Can Vote | 1 | ||
| • How You Can Vote | 1 | ||
| • How You May Revoke Your Proxy or Change Your Vote | 1 | ||
| • General Information on Voting | 1 | ||
| • Voting by Participants in the Company's 401(k) Profit Sharing Plan | 2 | ||
• Proposal 1—Election of Directors for a One-Year Term | 3 | ||
| • Nominees | 3 | ||
| • Meetings of the Board of Directors of the Company | 6 | ||
| • Corporate Governance Initiatives | 6 | ||
| • Committees of the Board of Directors | |||
| • Director Compensation and Related Transactions | |||
• Proposal 2—Adoption of the Motorola Omnibus Incentive Plan of | |||
| • | |||
15 | |||
• Ownership of Securities | 17 | ||
• Executive Compensation | 19 | ||
| • Summary Compensation Table | 19 | ||
| • Stock Option Grants in | |||
| • Aggregated Option Exercises in | |||
| • Long-Term Incentive Plans—No Awards in | |||
| • Retirement Plans | 23 | ||
| • Employment Contracts, Termination of Employment and Change in Control Arrangements | |||
• Report of Compensation Committee on Executive Compensation | |||
• Report of Audit and Legal Committee | |||
• Performance Graph | |||
• Other Matters | |||
• Appendix A: Audit and Legal Committee Charter | A-1 | ||
APPENDIX OF FINANCIAL INFORMATION | |||
• Management's Discussion and Analysis of Financial Condition and Results of Operations | F-1 | ||
• Financial Highlights | F-41 | ||
• Financial Statements and Notes | F-42 | ||
PROXY STATEMENT—VOTING PROCEDURES
The Board of Directors is soliciting proxies to be used at the May 6, 20025, 2003 Annual Meeting. Your vote is very important. This proxy statement, the form of proxy and the 20012002 Summary Annual Report will be mailed to stockholders on or about March 29, 2002.27, 2003. The Summary Annual Report is not a part of this proxy statement. The proxy statement and Summary Annual Report are also are available on the Company's website at www.motorola.com/investor.
Only stockholders of record at the close of business on March 15, 200214, 2003 (the "record date") will be entitled to notice of and to vote at the Annual Meeting or any adjournments thereof. On that date, there were 2,270,627,4342,315,606,622 issued and outstanding shares of the Company's common stock, $3 par value per share ("Common Stock"), the only class of voting securities of the Company.
This year thereThere are three convenient voting methods:
How You May Revoke Your Proxy or Change Your Vote
You can revoke your proxy at any time before it is voted at the 20022003 Annual Meeting by either:
No Cumulative Voting
You are entitled to cast one vote for each share of Common Stock you own on the record date. Stockholders do not have the right to vote cumulatively in electing directors.
Quorum Required
In order for business to be conducted, a quorum must be represented at the Annual Meeting. A quorum is a majority of the shares entitled to vote at the Annual Meeting. Shares represented by a proxy in which authority to vote for any matter considered is "withheld", a proxy marked "abstain" or a proxy as to which there is a "broker non-vote" will be considered present at the meeting for purposes of determining a quorum.
Required Vote to Elect Directors
Directors will be elected by a plurality of the votes cast at the Annual Meeting, meaning the 13 nominees receiving the most votes will be elected. Only votes cast for a nominee will be counted. Unless indicated otherwise by your proxy, the shares will be voted for the 13 nominees named in this proxy statement. Instructions on the accompanying proxy to withhold authority to vote for one or more of the nominees will result in those nominees receiving fewer votes but will not count as a vote against the nominees.
Required VotesVote to Pass Other ProposalsAdopt the Motorola Omnibus Incentive Plan of 2003
In order to (i) adopt the Motorola Omnibus Incentive Plan of 2002, (ii) authorize the amendment to the Motorola Employee Stock Purchase Plan of 1999, or (iii) recommend that the Board consider adoption of any shareholder proposal,2003, an affirmative vote of a majority of the shares present in person or by proxy and entitled to vote at the Annual Meeting is required. For each of these proposals,this proposal, an abstention will have the same effect as a vote against the proposal. Broker non-votes will not be voted for or against any of these proposalsthis proposal and will have no effect on any of these proposals.this proposal.
Other Information
If you are the beneficial owner of shares held in "street name" by a broker, the broker, as the record holder of the shares, is required to vote those shares in accordance with your instructions. If you do not give instructions to the broker, the broker will be entitled to vote the shares with respect to "discretionary" items but will not be permitted to vote the shares with respect to "non-discretionary" items
PROXY STATEMENT 1
(those shares are treated as "broker non-votes"). The election of directors and all other proposals in this proxy statement are "discretionary" items.
All shares that have been properly voted—whether by telephone, Internet or mail—and not revoked will be voted at the Annual Meeting in accordance with your instructions. If you sign your proxy card but do not give voting instructions, the shares represented by that proxy will be voted as recommended by the Board of Directors.
If any other matters are properly presented at the Annual Meeting for consideration, the persons named as proxies in the enclosed proxy card will have the discretion to vote on those matters for you. At the date we filed this proxy statement with the Securities and Exchange Commission, the Board of Directors did not know of any other matter to be raised at the Annual Meeting.
Voting by Participants in the Company's 401(k) Profit Sharing Plan
If a stockholder is a participant inowns shares of Common Stock through the Motorola 401(k) Profit Sharing Plan (the "401(k) Plan"), the proxy card also will serve as a voting instruction for the trustees of that plan where all accounts are registered in the same name. If shares of Common Stock in the 401(k) Plan are not voted either by telephone, via the Internet, or by returning the proxy card representing such shares, those shares will be voted by the trustees in the same proportion as the shares properly voted by other participants owning shares of Common Stock in the 401(k) Plan.
2 PROXY STATEMENT
PROPOSAL 1
ELECTION OF DIRECTORS FOR A ONE-YEAR TERM
The term of office of all present directors of the Company will expire on the day of the 20022003 Annual Meeting upon the election of their successors. The number of directors of the Company to be elected at the 20022003 Annual Meeting is 13. The directors elected at the 20022003 Annual Meeting will serve until their respective successors are elected and qualified or until their earlier death or resignation.
Each of the nominees named below except for Mr. Warner, is currently a director of the Company and each was elected at the Annual Meeting of stockholders held on May 7, 2001,6, 2002, except for Mr. BreenMs. Nooyi and Mr. WarnerZafirovski who are standing for election for the first time. Robert L. GrowneyAnne P. Jones is retiring from the Board and Ronnie C. Chan arewill not be standing for re-electionre-election. Ms. Jones is expected to enter into a consulting agreement with the Board.Company following her retirement. The ages shown areconsulting arrangement will enable the Board and the Company to continue to benefit from Ms. Jones knowledge of the Company and expertise as of December 31, 2001.the need arises.
If any of the nominees named below is not available to serve as a director at the time of the 20022003 Annual Meeting (an event which the Board does not now anticipate), the proxies will be voted for the election as director of such other person or persons as the Board may designate, unless the Board, in its discretion, reduces the number of directors. The ages shown are as of December 31, 2002.
  | CHRISTOPHER B. GALVIN, Principal Occupation: Chairman of the Board and Chief Executive Officer, Motorola, Inc. Director since 1988 Age— Mr. Galvin began working for the Company in 1967 and he served in sales, sales management, marketing, product management, service management and general management positions in the Company's various businesses. He served as President and Chief Operating Officer from 1993 until he became Chief Executive Officer on January 1, 1997. In June 1999, Mr. Galvin became Chairman of the Board. Mr. Galvin received a bachelor's degree from Northwestern University and a master's degree from the Kellogg Graduate School of Management at Northwestern University. | |
 | ||
  | FRANCESCO CAIO, Principal Occupation: Chief Executive Officer, Netscalibur Director since 2000 Age— Mr. Caio is the Chief Executive Officer of Netscalibur, a pan-European IP services provider. Mr. Caio is also a member of the Board of Merloni Elettrodomestici, where he was Chief Executive Officer from 1997 to 2000. Merloni Elettrodomestici is the third-largest manufacturer of domestic appliances in Europe. Mr. Caio obtained his Masters degree in Computer Science from the Politecnico di Milano and his MBA as a Luca Braito Scholar from INSEAD at Fountainbleau, France. Mr. Caio is a citizen of Italy. | |
PROXY STATEMENT 3
  | H. LAURANCE FULLER, Principal Occupation: Retired; Formerly Co-Chairman of the Board, BP Amoco, p.l.c. Director since 1994 Age— Mr. Fuller retired as Co-Chairman of BP Amoco, p.l.c., an energy company, in March 2000. Prior to holding that position, he had served as Chairman and Chief Executive Officer of Amoco Corporation since 1991. He is also a director of Abbott Laboratories, J.P. Morgan Chase & Co. and | |
 | ||
PROXY STATEMENT 3
  | JUDY C. LEWENT, Principal Occupation: Executive Vice President and Chief Financial Officer and President, Human Health Asia, Merck & Co., Inc. Director since 1995 Age— Ms. Lewent has been Executive Vice President | |
  | DR. WALTER E. MASSEY, Principal Occupation: President of Morehouse College Director since 1993 Age— Dr. Massey has been President of Morehouse College since 1995. In 1991, he was appointed by President Bush as the Director of the National Science Foundation after which he was Provost and Senior Vice President for the University of California System. Prior to that he had been director of the Argonne National Laboratory and vice president for research at the University of Chicago. Dr. Massey received a Ph.D. degree in Physics and a Master of Arts degree from Washington University. He also holds a Bachelor of Science degree in Physics and Mathematics from Morehouse College. He is a director of BP Amoco, p.l.c., BankAmerica Corporation and McDonalds, Inc. Dr. Massey previously served as a director of the Company from 1984 until 1991 when he accepted his appointment to the National Science Foundation. | |
  | NICHOLAS NEGROPONTE, Principal Occupation: Chairman of the Massachusetts Institute of Technology Media Laboratory Director since 1996 Age— Mr. Negroponte is a co-founder and | |
 | INDRA K. NOOYI, Principal Occupation: President and Chief Financial Officer, PepsiCo, Inc. Director since 2002 Age—47 Ms. Nooyi is President & Chief Financial Officer of PepsiCo, Inc., a world leader in convenient foods and beverages. She joined PepsiCo in 1994 as Senior Vice President of Strategic Planning, and she became Chief Financial Officer in 2000. Ms. Nooyi also serves on the Board of Directors of PepsiCo, Inc. and the PepsiCo Foundation. She serves as Successor Fellow at Yale Corporation and is on the Advisory Board of Yale University President's Council of International Activities. She is a member of the Board of the International Rescue Committee and Lincoln Center for the Performing Arts in New York City. Ms. Nooyi graduated from Madras Christian College in India with a degree in Chemistry, Physics and Math and earned a Master's Degree in Finance and Marketing from the Indian Institute of Management in Calcutta and a Master's Degree in Public and Private management from Yale University's School of Organization and Management. | |
4 PROXY STATEMENT
  | JOHN E. PEPPER, JR., Principal Occupation: Chairman of the Director since 1994 Age— Mr. Pepper is Chairman of the | |
4 PROXY STATEMENT
  | SAMUEL C. SCOTT III, Principal Occupation: Chairman, President and Chief Executive Officer, Corn Products International Director since 1993 Age— Mr. Scott is Chairman, President and Chief Executive Officer of Corn Products International, a corn refining business. He was President of the Corn Refining Division of CPC International from 1995 through 1997, when CPC spun off Corn Products International as a separate corporation. Mr. Scott also serves on the Board of Directors of | |
  | DOUGLAS A. WARNER III, Principal Occupation: Retired; Formerly Chairman of the Board, J.P. Morgan Chase & Co. Mr. Warner was Chairman of the Board and Co-Chairman of the Executive Committee of J.P. Morgan Chase & Co., an international commercial and investment banking firm from December 2000 until he retired in November 2001. From 1995 to 2000, he was Chairman of the Board, President, and Chief Executive Officer of J.P. Morgan & Co. He is also a director of Anheuser-Busch Companies, Inc. and General Electric Co. He is on the Board of Counselors of the Bechtel Group Inc. and is a member of The Business Council. He is chairman of the Board of Managers and the Board of Overseers of Memorial Sloan-Kettering Cancer Center. Mr. Warner is a trustee of the Pierpont Morgan Library and a member of the Yale Investment Committee. Mr. Warner received a B.A. degree from Yale University. | |
  | B. KENNETH WEST, Principal Occupation: Senior Consultant for Corporate Governance to Teachers Insurance and Annuity Association—College Retirement Equities Fund Director since 1976 Age— Mr. West is serving as Senior Consultant for Corporate Governance to TIAA-CREF, a major pension fund company. He retired as chairman of Harris Bankcorp, Inc. in 1995 where he had been employed since 1957. He is also a director of The Pepper Companies, Inc. and chairman of the board of the National Association of Corporate Directors (NACD). Mr. West graduated from the University of Illinois and received an MBA degree from the University of Chicago. | |
  | DR. JOHN A. WHITE, Principal Occupation: Chancellor, University of Arkansas Director since 1995 Age— Dr. White is currently Chancellor of the University of Arkansas. Dr. White served as Dean of Engineering at Georgia Institute of Technology from 1991 to early 1997, having been a member of the faculty since 1975. He is also a director of Eastman Chemical Company, J.B. Hunt Transport Services, Inc., Logility, Inc., and Russell Corporation. Dr. White received a B.S.I.E. from the University of Arkansas, a M.S.I.E. from Virginia Polytechnic Institute and State University and a Ph.D. from The Ohio State University. | |
 | MIKE S. ZAFIROVSKI, Principal Occupation: President and Chief Operating Officer, Motorola, Inc. Director since 2002 Age—49 Mr. Zafirovski joined Motorola in June 2000 and served as Executive Vice President and President of the Personal Communications Sector until July 25, 2002 when he was elected President and Chief Operating Officer. Prior to joining Motorola, Mr. Zafirovski spent 24 years with General Electric Company, where he served as President and CEO of GE Lighting, General Electric Company from July 1999 to May 2000 and as President and CEO of GE Lighting, Europe, Middle East and Africa, General Electric Company from April 1996 to June 1999. Mr. Zafirovski received a Bachelor of Science degree in mathematics from Edinboro University and serves on the board of directors of United Way of Lake County Illinois and Children's Memorial Hospital in Chicago. | |
PROXY STATEMENT 5
MEETINGS OF THE BOARD OF DIRECTORS OF
THE COMPANY
The Board of Directors is responsible for supervision of the overall affairs of the Company. The Board of Directors held 1214 meetings during 2001.2002. Overall attendance at Board and committee meetings was 91%93%. All directors attended 75% or more of the combined total meetings of the Board and the committees on which they served during 2001.2002, with the exception of Ms. Nooyi, who became a director on November 1, 2002 and attended 2 of 3 meetings during the remainder of 2002. The non-employee members of the Board also met in executive session without management 3 times in 2002.
Following the Annual Meeting, the Board will consist of 13 directors. In the interim between Annual Meetings, the Board has the authority under the By-laws to increase or decrease the size of the Board and fill vacancies.
CORPORATE GOVERNANCE INITIATIVES
The Board has long adhered to governance principles designed to assure the continued vitality of the Board and excellence in the execution of its duties. The Board has responsibility for management oversight and providing strategic guidance to the Company. In order to do that effectively, the Board believes it should be comprised of individuals with appropriate skills and experiences to contribute effectively to this dynamic process. The Board is currently highly diversified; it is comprised of active and former CEOs and CFOs of major corporations and individuals with experience in high-tech fields, government and academia. The Board also believes that it must continue to renew itself to ensure that its members understand the industries and the markets in which the Company operates.
As part of its renewal process, the Board previously committed to devote entire meetings to reviewing the Company's short-term and long-term strategies. The Board met this commitment and devoted a great deal of time to reviewing the Company's strategy during 2001. That focus will continue in 2002. In addition to reviewing the Company's strategy, the Board also followed-up with each significant business during the year to ensure that the business was meeting its commitments or adjusting those strategies to respond to the dynamic market conditions during the year.
The Board also adopted an improved Director Assessmentbelieves that it must be informed about the positive and Review Program. A key element of that Program is that everynegative issues, problems and challenges facing Motorola and its industries and markets so the members can exercise their fiduciary responsibilities to shareholders.
Over the last five years, beginningthe Chairman of the Board and Chief Executive Officer of Motorola, Christopher Galvin, has twice introduced renewal efforts to improve board governance. In response, the Board of Directors formed Ad Hoc Committees in February 2000 and January 2002 to drive this renewal. The members of these committees were John Pepper, past chairman and chief executive officer of Procter & Gamble who chaired the committee, Ken West, past chairman and chief executive officer of Harris Bank Corp. and now Senior Consultant for Corporate Governance at TIAA-CREF, and Christopher Galvin.
The 2002 Ad Hoc Committee on Governance devoted considerable time to further improving Motorola's governance, building on the work of the 2000 Ad Hoc Committee. The 2002 Ad Hoc Committee on Governance considered all aspects of how the board functions, including: meeting effectiveness; director involvement, development and retention; committee governance, effectiveness and composition; board and committee assessment; director assessment and review; board size, composition and independence; executive sessions; and calendar and attendance.
Some of the highlights of the Board's enhanced governance include:
These are just some of the Program, including overallhighlights of the Board's robust governance. The Board assessmentis committed to governance renewal and committee assessment, were also completed during the year.Governance and Nominating Committee will continue to build on the work of the 2000 Ad Hoc
6 PROXY STATEMENT
Committee and the 2002 Ad Hoc Committee on Governance to ensure that Motorola remains at the forefront of governance.
COMMITTEES OF THE BOARD OF DIRECTORS
To assist it in carrying out its duties, the Board has delegated certain authority to several committees. The Board currently has 76 standing committees. TheAs a result of the work of the 2002 Ad Hoc Committe on Governance described above, on February 4, 2003, the Board hasmade a number of changes in committee composition and membership. This included changing the names of certain committees and combining the former Compensation Committee and Management Development Committee into a single, new committee, the Compensation and Leadership Committee.
On February 4, 2003, the Board determined the anticipated membership of each committee for the upcoming year. Accordingly, included in the brief summaries below is the membership of each committee during the past yearat December 31, 2002 and the anticipated membership for the upcoming year.
Audit and Legal Committee
Members during 2001:at 12/31/02: Directors Jones (Chair) (not standing), Fuller, Lewent and White
Anticipated Members for Next Year: Directors Jones (Chair)Fuller (Chair since 1/1/03), Fuller, LewentWest and White
Number of Meetings in 2001: Four2002: Seven
Functions:
Compensation and Leadership Committee (combination of former Compensation Committee and former Management Development Committee)
Members during 2001: Directors Scott (Chair), Fuller and PepperAnticipated Members for Next Year:of Compensation Committee at 12/31/02: Directors Scott (Chair), Fuller and Pepper
Number of Meetings in 2001: Sevenof Compensation Committee during 2002: Six
Members of Management Development Committee at 12/31/02: Directors West (Chair), Galvin and Scott
Number of Meetings of Management Development Committee during 2002: Four
Anticipated Members of the Compensation and Leadership Committee for Next Year: Directors Scott (Chair), Nooyi, Warner and West
Functions:
Executive Committee
Members during 2001:at 12/31/02: Directors Galvin (Chair), Fuller, Growney (not standing), Lewent, Pepper, Scott, West and WestZafirovski
Anticipated Members for Next Year: Directors Galvin (Chair), Breen, Fuller, Lewent, Pepper, Scott, West and WestZafirovski
Number of Meetings in 2001:2002: None
6 PROXY STATEMENT
Finance Committee
Members during 2001:at 12/31/02: Directors Lewent (Chair), Chan (not standing), Growney (not standing)Caio, Warner, West and WestZafirovski
Anticipated Members for Next Year: Directors Lewent (Chair), Breen, Caio, Warner and WestZafirovski
Number of Meetings in 2001: Four2002: Five
Functions:
Management Development PROXY STATEMENT 7
Governance and Nominating Committee (formerly known as Nominating Committee)
Members during 2001: Directors West (Chair), Galvin and ScottAnticipated Members for Next Year: Directors West (Chair), Galvin and ScottNumber of Meetings in 2001: FourFunctions:
Nominating Committee
Members during 2001:at 12/31/02: Directors Pepper (Chair), ChanJones (not standing), Jones, Massey, Negroponte and NegroponteWarner
Anticipated Members for Next Year: Directors Pepper (Chair), Jones, Massey, Negroponte and WarnerNooyi
Number of Meetings in 2001: Three2002: Two
Functions:
This Committee will consider a candidate for director proposed by a stockholder. A candidate must be highly qualified and be both willing and expressly interested in serving on the Board. A stockholder wishing to propose a candidate for the Committee's consideration should forward the candidate's name and information about the candidate's qualifications to the Company's Secretary as described on page 30.31.
Technology and Design Committee (formerly known as Technology Committee)
Members during 2001:at 12/31/02: Directors Massey (Chair), Caio, Growney (not standing), Negroponte, White and WhiteZafirovski
Anticipated Members for Next Year: Directors Massey (Chair), Breen, Caio, NegroponteGalvin and WhiteNegroponte
Number of Meetings in 2001:2002: Four
Functions:
DIRECTOR COMPENSATION AND RELATED TRANSACTIONS
Directors who are also employees of Motorola receive no additional compensation for serving on the Board or its committees.
For each non-employee director,During 2002, the annual retainer fee is $60,000 andpaid to each non-employee director was $60,000. In addition, each non-employee director who isserved as a chair of a committee receivesreceived an additional $4,000 per year.annual fee. The Company also reimburses its directors, and in certain instancescircumstances spouses who accompany directors, for travel, lodging and related expenses they incur in attending Board and committee meetings.
On May 7, 2002, each non-employee director received options to acquire 15,000 shares of Common Stock at the fair market value of the shares on the date of grant.
The fees paid to the Company's directors have not changed since 2000. After reviewing the fees paid to directors of other companies in the Company's peer group and recognizing the ever-increasing demands on directors of public companies, the Board revised its compensation program, effective January 1, 2003. In 2003, the annual retainer fee paid to each non-employee director will increase to $75,000. The non-employee director chairs of the Audit and Legal Committee and Compensation and Leadership Committee will receive an additional $12,000 annual fee. Non-employee directors who serve as chairs of other committees will receive an additional $5,000 annual fee. In addition, the members of the Audit and Legal Committee (other than the Chair) will receive an additional $5,000 annual fee. Directors are expected to continue to be granted options to purchase shares of Common Stock each year.
Directors are required to accept half of all their Board compensation in Common Stock or restricted Common Stock, and may elect to accept up to 100% of their compensation in Common Stock or restricted Common Stock. Restricted Common Stock is Common Stock that may not be transferred and is subject to repurchase by Motorola until either: (i) the holder has served as a member of the Board for at least four years and does not stand for re-election or is not re-elected, or (ii) the holder's disability or death. Non-employee directors may elect to defer receipt of all or any portion of their compensation that is not otherwise required to be paid in Common Stock or restricted Common Stock. Since 2001, non-employee directors can elect to participate in the Motorola Management Deferred Compensation Plan. This plan offers a wide variety of investment options. Directors may elect to have distributions while they are directors or after they retire from the Board.
On June 1, 2001, each non-employee director received an option to acquire 15,000 shares of Common Stock at the fair market value of the shares on the date of grant.
PROXY STATEMENT 7
In 1996, the Board terminated its retirement plan. Non-employee directors elected to the Board after the termination date are not entitled to benefits under this plan, and non-employee directors already participating in the plan accrued no additional benefits for services after May 31, 1996. In 1998, some directors converted their accrued benefits in the retirement plan into shares of restricted Common Stock. They may not sell or transfer these shares and these shares are subject to repurchase by Motorola until they are no longer members of the Board because either: (i) they did not stand for re-election or were not re-elected, or (ii) their disability or death. Directors Jones and Massey did not convert their accrued benefits in the retirement plan and are entitled to receive payment of such benefits in accordance with the applicable payment terms of the retirement plan, including payments to spouses in the event of death. For each year of service on the Board prior to the date the plan was terminated, these directors are entitled to receive annual payments equal to 10% of the annual retainer for directors
8 PROXY STATEMENT
in effect on the date the plan was terminated, with a maximum annual payment equal to 80% of the retainer. Each of these Directors had served on the Board for eight or more years prior to the termination of the plan and, accordingly, are fully vested and will be entitled to an annual payment of $32,000.$32,000 upon retirement from the Board.
Non-employee directors are covered by insurance that provides accidental death and dismemberment coverage of $500,000 per person. The spouse of each such director is also covered by such insurance when traveling with the director on business trips for the Company. The Company pays the premiums for such insurance. The total premiums for coverage of all such directors and their spouses during the year ended December 31, 20012002 was $3,500.$2,750.
Motorola has obtained investment banking and other financial services from J.P. Morgan Chase & Co. ("J.P. Morgan Chase") and certain of its subsidiaries. Mr.Director Warner served as Chairman of the Board and Co-Chairman of the Executive Committee of J.P. Morgan Chase from December 2000 until he retired in November 2001. As further described under "Legal Proceedings" in the Company's Form 10-K for the year ended December 31, 2001,2002, Motorola and The Chase Manhattan Bank ("Chase Manhattan"), a wholly-owned subsidiary of J.P. Morgan Chase, arewere involved in a number of lawsuits relating to loans extended by a group of lenders (for whom Chase Manhattan acted as agent) to Iridium LLC. The parties to these lawsuits reached a settlement in March 2003.
THE BOARD OF DIRECTORS RECOMMENDS A VOTEFOR THE ELECTION OF THE NOMINEES NAMED HEREIN AS DIRECTORS. UNLESS INDICATED OTHERWISE BY YOUR PROXY VOTE, THE SHARES WILL BE VOTEDFOR THE ELECTION AS DIRECTORS OF SUCH NOMINEES.
PROPOSAL 2
ADOPTION OF THE MOTOROLA OMNIBUS INCENTIVE PLAN OF 20022003
The Board has adopted the Motorola Omnibus Incentive Plan of 20022003 (the "2002"2003 Plan") and is recommending that stockholders approve the 20022003 Plan at the Annual Meeting. The 20022003 Plan is integral to the Company's compensation strategies and programs. The use of stock options and other stock awards among technology companies is widely prevalent. The 20022003 Plan will maintain the flexibility that Motorola needs to keep pace with its competitors and effectively recruit, motivate, and retain the caliber of employees essential for achievement of the Company's success.
The 20022003 Plan will permit stock option grants, annual management incentive awards, stock grants, restricted stock grants, restricted stock unit grants, performance stock grants, performance unit grants, stock appreciation rights grants ("SARs"), and cash awards. Stockholder approval of the 20022003 Plan will permit the performance-based awards discussed below to qualify for deductibility under Section 162(m) of the Internal Revenue Code ("Code").
Awards and grants under the 20022003 Plan are referred to as "Benefits." Those eligible for Benefits under the 20022003 Plan are referred to as "Participants." Participants include all employees of the Company and its subsidiaries and all non-employee directors of the Company.
As of December 31, 2001,2002, approximately 58.329 million shares were available for new grants under the Company's existing stock incentive plans and there were approximately 219.5280.8 million shares subject to outstanding benefits under these and predecessor plans. While the existing stock incentive plans will remain in place, they do not provide sufficient shares for market-competitive grant levels prior to the 20032004 stockholder meeting.
8 PROXY STATEMENT 9
A summary of the principal features of the 20022003 Plan is provided below, but is qualified in its entirety by reference to the full text of the 20022003 Plan that was filed electronically with this proxy statement with the Securities and Exchange Commission. Such text is not included in the printed version of this proxy statement. A copy of the 20022003 Plan is available from the Company's Secretary at the address on the cover of this document.
Shares Available for Issuance
The aggregate number of shares of Common Stock that may be issued under the 20022003 Plan will not exceed 4595 million (subject to the adjustment provisions discussed below). The 4595 million new shares represent 2.04.1 percent of the currently outstanding shares of Common Stock.
The number of shares that may be issued under the 20022003 Plan for Benefits other than stock options and SARs will not exceed a total of 540 million shares (subject to the adjustment provisions discussed below).
Administration and Eligibility
The 20022003 Plan will be administered by a Committee of the Board (the "Committee") consisting of two or more directors, each of whom will satisfy the requirements established for administrators acting under plans intended to qualify as a "non-employee director" within the meaning set forth infor exemption under Rule 16b-3 promulgated under the Securities Exchange Act of 1934 as amended (the "Exchange("Exchange Act")., for outside directors acting under plans intended to qualify for exemption under Section 162(m) of the Code and with any applicable requirements established by the New York Stock Exchange. The Committee will approve the aggregate Benefits and the individual Benefits for the most senior elected officers and non-employee directors. The Committee may delegate some of its authority under the administration of the 20022003 Plan in accordance with the terms of the 20022003 Plan.
No Participant may receive in any Plan Year:calendar year: (i) stock options relating to more than 3,000,0003 million shares; (ii) restricted stock or restricted stock units that are subject to the attainment of performance goals (as described below) relating to more than 300,0001.5 million shares; (iii) SARs relating to more than 3,000,0003 million shares; or (iv) performance shares relating to more than 300,0001.5 million shares. No non-employee director may receive in any calendar year (i) stock options relating to more than 30,000 shares (allor (ii) restricted stock units relating to more than 30,000 shares. (Each of thesethe above limits is subject to the adjustment provisions discussed below).below.) The maximum amount that may be earned under Performance Unit awards by any Participant who is a covered employee within the meaning of Section 162(m) of the Code ("Covered Employee") in any calendar year may not exceed $5,000,000.$8.5 million.
Benefits
Stock Options
Grants of Options
The Committee is authorized to grant stock options to Participants ("Optionees"), which may be either incentive stock options ("ISOs") or nonqualified stock options ("NSOs"). NSOs and ISOs are collectively referred to as "Stock Options." The exercise price of any Stock Option must be equal to or greater than the fair market value of the shares on the date of the grant. The term of a Stock Option cannot exceed 10 years. ISOs may not be granted more than 10 years after the date that the 20022003 Plan was adopted by the Board.
For purposes of the 20022003 Plan, fair market value shall be determined in such manner as the Committee may deem equitable, or as required by applicable law or regulation. Generally, fair market value means the closing price on the last trading day preceding the day of the transaction, as reported for the New York Stock Exchange Composite Transactions in the Wall Street Journal.
Exercisability and Termination
At the time of grant, the Committee in its sole discretion will determine when Options are exercisable and when they expire.
Payment of Option Price
Payment for shares purchased upon exercise of a Stock Option must be made in full at the time of purchase. Payment may be made in cash, by the transfer to the Company of shares owned by the Participant for(held at least six months (valued atif the Company is accounting for Stock Options using APB Opinion 25 or purchased on the open market) having a fair market value on the date of transfer) or atransfer equal to the option exercise price (or certification of ownership of such sharesshares) or in such other manner as may be authorized by the Committee.
SARs
The Committee has the authority to grant SARs to Participants and to determine the number of shares subject to each SAR, the term of the SAR, the time or times at which the SAR may be exercised, and all other terms and conditions of the SAR. A SAR is a right, denominated in shares, to receive, upon exercise of the right, in whole or in part, without payment to the Company an amount, payable in shares, in cash or a combination thereof, that is equal to the excess of: (i) the fair market value of Common Stock on the date of exercise of the right; over (ii) the fair market value of Common Stock on the date of grant of the right multiplied by the number of shares for which the right is exercised. The Committee also may, in its discretion, substitute SARs which can be settled only in Common Stock for outstanding Stock Options at any time when the Company is subject to fair value accounting. The terms and conditions of any substitute SAR shall be substantially the same as those applicable to the Stock Option that it replaces and the term of the substitute SAR shall not exceed the term of the Stock Option that it replaces.
Restricted Stock and Restricted Stock Units
Restricted Stock consists of shares which are transferred or sold by the Company to a Participant, but are subject to substantial risk of forfeiture and to restrictions on their sale or other transfer by the Participant. Restricted Stock Units are the right to receive shares at a future date in accordance
10 PROXY STATEMENT
with the terms of such grant upon the attainment of certain conditions specified by the Committee.Committee which include substantial risk of forfeiture and restrictions on their sale or other transfer by the Participant. The Committee determines the eligible Participants to whom, and the time or times at which, grants of Restricted Stock or Restricted Stock Units will be made, the number of shares or units to be granted, the price to be paid, if any, the time or times within which the shares covered by such grants will be subject to forfeiture, the time or times at which the restrictions will terminate, and all other terms and conditions of the grants. Restrictions or conditions could include, but are not limited to, the attainment of performance goals (as described below), continuous service with the Company, the passage of time or other restrictions or conditions. Generally, the Restricted Stock and Restricted Stock Units that are currently outstanding vest between three to five years after the date of grant.
Performance Stock
A Participant who is granted Performance Stock has the right to receive shares or cash or a combination of shares and cash equal to the fair market value of such shares at a future date in accordance with the terms of such grant and upon the attainment of performance goals specified by the Committee.
The award of Performance Stock to a Participant will not create any rights in such Participant as a stockholder of the Company until the issuance of Common Stock with respect to an award.
PROXY STATEMENT 9
Performance Units
A Participant who is granted Performance Units has the right to receive a payment in cash upon the attainment of performance goals.goals specified by the Commitee. The Committee may substitute actual shares of Common Stock for the cash payment otherwise required to be made pursuant to a Performance Unit award.
Performance Goals
Awards of Restricted Stock, Restricted Stock Units, Performance Stock, Performance Units and other incentives under the 20022003 Plan may be made subject to the attainment of performance goals relating to one or more business criteria within the meaning of Section 162(m) of the Code, including, but not limited to: cash flow; cost; ratio of debt to debt plus equity; profit before tax; economic profit; earnings before interest and taxes; earnings before interest, taxes, depreciation and amortization; earnings per share; operating earnings; economic value added; ratio of operating earnings to capital spending; free cash flow; net profit; net sales; sales growth; price of the Common Stock; return on net assets, equity, or stockholders' equity; market share; or total return to stockholders ("Performance Criteria").
Any Performance Criteria may be used to measure the performance of the Company as a whole or any business unit of the Company and anymay be measured relative to a peer group or index. Any Performance Criteria may be adjusted to include or exclude extraordinary items.
SARs
The Committee hasspecial items as identified in the authority to grant SARs to Participants and to determine the number of shares subject to each SAR, the term of the SAR, the timeCompany's quarterly or times at which the SAR may be exercised, and all other terms and conditions of the SAR. An SAR is a right, denominated in shares, to receive, upon exercise of the right, in whole or in part, without payment to the Company an amount, payable in shares, in cash or a combination thereof, that is equal to the excess of: (i) the fair market value of Common Stock on the date of exercise of the right; over (ii) the fair market value of Common Stock on the date of grant of the right multiplied by the number of shares for which the right is exercised. It is anticipated that SARs primarily will be used in place of stock options, and any appreciation in value will be paid in cash, in order to comply with the laws and regulations of foreign jurisdictions or to make the grant a more effective form of compensation in a foreign jurisdiction.annual earnings releases.
Annual Management Incentive Awards
The Committee has the authority to grant Management Incentive Awards to designated executive officers of the Company or any subsidiary.
Management Incentive Awards will be paid out of an incentive pool equal to 5 percent of the Company's consolidated operating earnings for each calendar year. The Committee will allocate an incentive pool percentage to each designated Participant for each calendar year. In no event, may the incentive pool percentage for any one Participant exceed 30 percent of the total pool. For purposes of the 20022003 Plan, "consolidated operating earnings" will mean the consolidated earnings before income taxes of the Company, computed in accordance with generally accepted accounting principles, but shall exclude the effects of extraordinaryspecial items. ExtraordinarySpecial items mean:include: (i) extraordinary, unusual, and/or nonrecurring items of gain or loss;loss, (ii) gains or losses on the disposition of a business;business, (iii) changes in tax or accounting regulations or laws;laws, or (iv) the effect of a merger or acquisition.acquisition, all as identified in the Company's quarterly and annual earnings releases. The Participant's incentive award then will be determined by the Committee based on the Participant's allocated portion of the incentive pool subject to adjustment in the sole discretion of the Committee. In no event may the portion of the incentive pool allocated to a Participant who is a Covered Employee be increased in any way, including as a result of the reduction of any other Participant's allocated portion.
Stock Awards
The Committee may award shares of Common Stock to Participants without payment therefore, as additional compensation for service to the Company or a subsidiary. Stock awards may be subject to other terms and conditions, which may vary from time to time and among employees, as the Committee determines to be appropriate.
Cash Awards
A cash award consists of a monetary payment made by the Company to an employee as additional compensation for his or her services to the Company or a subsidiary. A cash award may be made in tandem with another Benefit or may be made independently of any other Benefit. Cash awards may be subject to other terms and conditions, which may vary from time to time and among employees, as the Committee determines to be appropriate.
Amendment of the 20022003 Plan
The Board or the Committee has the right and power to amend the 20022003 Plan, provided, however, that neither the Board nor the Committee may amend the 20022003 Plan in a manner which would impair or adversely affect the rights of the holder of a Benefit without the holder's consent. IfNo material amendment of the Code or any other applicable statute, rule or regulation, including, but not limited to, those of any securities exchange, requiresPlan shall be made without stockholder approval with respect to the 2002 Plan or any type of amendment thereto, then to the extent so required, stockholder approval will be obtained.approval.
PROXY STATEMENT 11
Termination of the 20022003 Plan
The Board may terminate the 20022003 Plan at any time. Termination will not in any manner impair or adversely affect any Benefit outstanding at the time of termination.
Committee's Right to Modify Benefits
Any Benefit granted may be converted, modified, forfeited, or canceled, in whole or in part, by the Committee if
10 PROXY STATEMENT
and to the extent permitted in the 2002 Plan, or applicable agreement entered into in connection with a Benefit grant or with the consent of the Participant to whom such Benefit was granted. The Committee may grant Benefits on terms and conditions different than those specified in the 20022003 Plan to comply with the laws and regulations of any foreign jurisdiction, or to make the Benefits more effective under such laws and regulations.
The Committee may permit or require a Participant to have amounts or shares of Common Stock that otherwise would be paid or delivered to the Participant as a result of the exercise or settlement of an award under the 2003 Plan credited to a deferred compensation or stock unit account established for the Participant by the Committee on the Company's books of account.
Neither the Board nor the Committee may cancel any outstanding Stock Option for the purpose of reissuing the option to the Participant at a lower exercise price, or to reduce the option price of an outstanding option.
Change in Control
Stock Options
Upon the occurrence of a Change in Control, each Stock Option outstanding on the date on which the Change in Control occurs will immediately become exercisable in full.
Restricted Stock and Restricted Stock Units
Upon the occurrence of a Change in Control, the restrictions on all shares of Restricted Stock and Restricted Stock Units outstanding on the date on which the Change in Control occurs will be automatically terminated. With regard to Restricted Stock Units, shares of Common Stock will be delivered to the Participant in the amount or amounts as determined in accordance with the terms and conditions in the applicable agreement relating to Restricted Stock Units.
Performance Stock
Upon the occurrence of a Change in Control, any performance goal with respect to any outstanding Performance Stock will be deemed to have been attained at target levels, and shares of Common Stock or cash will be paid to the Participant in an amount or amountsas determined in accordance with the terms and conditions set forth in the applicable agreement relating to the Performance Stock.
Performance Units
Upon the occurrence of a Change in Control, any performance goal with respect to any outstanding Performance Units will be deemed to have been attained at target levels, and the cash (or shares of Common Stock) will be paid to the Participant in an amount or amountsas determined in accordance with the terms and conditions set forth in the applicable agreement relating to the Performance Units.
SARs
Upon the occurrence of a Change in Control, each SAR outstanding on the date on which the Change in Control occurs will immediately become exercisable in full.
Management Incentive Awards
Upon the occurrence of a Change in Control, all Management Incentive Awards will be paid out based on the consolidated operating earnings of the immediately preceding year, or such other method of payment as may be determined by the Committee (prior to the Change in Control).
Other Stock or Cash Awards
Upon the occurrence of a Change in Control, any terms and conditions with respect to other stock or cash awards previously granted under the 20022003 Plan will be deemed to be fully satisfied and the other stock or cash awards will be paid out immediately to the Participants, in amountsas determined in accordance with the terms and conditions set forth in the applicable grant, award, or agreement relating to such Benefits.
For purposes of the 20022003 Plan, the term "Change in Control" is defined as: (i) any change in the person or group that possesses, directly or indirectly, the power to direct or cause the direction of the management and the policies of the Company, whether through the ownership of voting securities, by contract or otherwise; (ii) the acquisition, directly or indirectly, of securities of the Company representing at least 20 percent of the combined voting power of the outstanding securities of the Company (other than by the Company, or any employee benefit plan of the Company); (iii) the consummation of certain mergers and consolidations involving the Company; (iv) the consummation of the sale or other disposition of all or substantially all of the Company's assets; (v) athe approval of liquidation or dissolution of the Company approved by its stockholders; and (vi) a change in the majority of the Board of the Company in existence prior to the first public announcement relating to any cash tender offer, exchange offer, merger or other business combination, sale of assets, proxy or consent solicitation (other than by the Board of the Company), contested election or substantial stock accumulation.
Adjustments
If there is any change in the Common Stock by reason of any stock split, stock dividend, spin-off, split-up, spin-out, recapitalization, merger, consolidation, reorganization, combination, or exchange of shares, the total number of shares available for Benefits, the maximum number of
12 PROXY STATEMENT
shares which may be subject to an award in any calendar year and the number of shares subject to outstanding Benefits, and the price of each of the foregoing, as applicable, will be equitably adjusted by the Committee in its discretion.
Subject to the Change-in-Control provisions, without affecting the number of shares reserved or available hereunder, either the Board or the Committee may authorize the issuance or assumption of Benefits in connection with any merger, consolidation, acquisition of property or stock, or reorganization upon such terms and conditions as it deems appropriate.
PROXY STATEMENT 11
In the event of any merger, consolidation, or reorganization in whichof the Company is notwith or into another corporation which results in the continuing corporation,Company's outstanding Common Stock being converted into or exchanged for different securities, cash, or other property, there shall be substituted on an equitable basis as determined by the Committee, for each share of common stockCommon Stock subject to a Benefit, the number and kind of shares of stock, other securities, cash, or other property to which holders of Common Stock of the Company are entitled pursuant to the transaction.
Substitution and Assumption of Benefits
Without affecting the number of shares reserved or available under the 2003 Plan, either the Board or the Committee may authorize the issuance of Benefits in connection with the assumption of, or substitution for, outstanding benefits previously granted to individuals who become employees of the Company or any subsidiary as the result of any merger, consolidation, acquisition of property or stock, or reorganization other than a Change in Control, upon such terms and conditions as it deems appropriate.
Reusage
If a Stock Option granted under the 20022003 Plan expires or is terminated, surrendered or canceled without having been fully exercised or if Restricted Stock, Restricted Stock Units, Performance Shares or SARs granted under the 20022003 Plan are forfeited or terminated without the issuance of all of the shares subject thereto, the shares covered by such Benefits will again be available for use under the 20022003 Plan. Shares covered by a Benefit granted under the 20022003 Plan would not be counted as used unless and until they are actually issued and delivered to a Participant. Any shares of Common Stock covered by a SAR shall be counted as used only to the extent shares are actually issued to the Participant upon exercise of the SAR. The number of shares which are transferred to the Company by a Participant to pay the exercise or purchase price of a Benefit will be subtracted from the number of shares issued with respect to such Benefit for the purpose of counting shares used. Shares withheld to pay withholding taxes in connection with the exercise or payment of a Benefit will not be counted as used. Shares covered by a Benefit granted under the 20022003 Plan that is settled in cash will not be counted as used.
Federal Income Tax Consequences
The Company has been advised by counsel that the federal income tax consequences as they relate to Benefits are as follows:
ISOs
An Optionee does not generally recognize taxable income upon the grant or upon the exercise of an ISO. Upon the sale of ISO shares, the Optionee recognizes income in an amount equal to the difference, if any, between the exercise price of the ISO shares and the fair market value of those shares on the date of sale. The income is taxed at long-term capital gains rates if the Optionee has not disposed of the stock within two years after the date of the grant of the ISO and has held the shares for at least one year after the date of exercise and the Company is not entitled to a federal income tax deduction. The holding period requirements are waived when an Optionee dies.
The exercise of an ISO may in some cases trigger liability for the alternative minimum tax.
If an Optionee sells ISO shares before having held them for at least one year after the date of exercise and two years after the date of grant, the Optionee recognizes ordinary income to the extent of the lesser of: (i) the gain realized upon the sale; or (ii) the difference between the exercise price and the fair market value of the shares on the date of exercise. Any additional gain is treated as long-term or short-term capital gain depending upon how long the Optionee has held the ISO shares prior to disposition. In the year of disposition, the Company receives a federal income tax deduction in an amount equal to the ordinary income whichthat the Optionee recognizes as a result of the disposition.
NSOs
An Optionee does not recognize taxable income upon the grant of an NSO. Upon the exercise of such a Stock Option, the Optionee recognizes ordinary income to the extent the fair market value of the shares received upon exercise of the NSO on the date of exercise exceeds the exercise price. The Company receives an income tax deduction in an amount equal to the ordinary income that the Optionee recognizes upon the exercise of the Stock Option.
Restricted Stock
A Participant who receives an award of Restricted Stock does not generally recognize taxable income at the time of the award. Instead, the Participant recognizes ordinary income in the first taxable year in which his or her interest in the shares becomes either: (i) freely transferable; or (ii) no longer subject to substantial risk of forfeiture. The amount of taxable income is equal to the fair market value of the shares less the cash, if any, paid for the shares.
A Participant may elect to recognize income at the time he or she receives Restricted Stock in an amount equal to
PROXY STATEMENT 13
the fair market value of the Restricted Stock (less any cash paid for the shares) on the date of the award.
The Company receives a compensation expense deduction in an amount equal to the ordinary income recognized by the Participant in the taxable year in which restrictions lapse (or in the taxable year of the award if, at that time, the Participant had filed a timely election to accelerate recognition of income).
Other Benefits
In the case of an exercise of an SAR or an award of Restricted Stock Units, Performance Stock, Performance Units, or Common Stock or cash, the Participant will generally recognize ordinary income in an amount equal to any cash received and the fair market value of any shares received on the date of payment or delivery. In that taxable year, the Company will receive a federal income tax deduction in an amount equal to the ordinary income which the Participant has recognized.
Million Dollar Deduction Limit
The Company may not deduct compensation of more than $1,000,000 that is paid to an individual who, on the last day of the taxable year, is either the Company's chief executive officer or is among one of the four other most highly-compensated officers for that taxable year.year as reported in the Company's proxy statement. The limitation on deductions does not apply to certain types of compensation, including qualified performance-based compensation. The Company believes that Benefits in the form of
12 PROXY STATEMENT
Stock Options, Performance Stock, Performance Units, SARs, performance-based Restricted Stock and Restricted Stock Units and cash payments under Management Incentive Awards constitute qualified performance-based compensation and, as such, will be exempt from the $1,000,000 limitation on deductible compensation.
Miscellaneous
A new benefits table is not provided because no grants have been made under the 20022003 Plan and all Benefits are discretionary. On March 15, 2002,14, 2003, the closing price of the Common Stock was $14.00.$8.19.
Approval by Stockholders
In order to be adopted, the 20022003 Plan must be approved by the affirmative vote of a majority of the outstanding shares represented at the meeting and entitled to vote.
RECOMMENDATION OF THE BOARD
THE BOARD OF DIRECTORS RECOMMENDS A VOTEFOR ADOPTION OF THE MOTOROLA OMNIBUS INCENTIVE PLAN OF 2002.2003. UNLESS OTHERWISE INDICATED ON THE PROXY, THE SHARES WILL BE VOTEDFOR ADOPTION OF THE MOTOROLA OMNIBUS INCENTIVE PLAN OF 2002.2003.
14 PROXY STATEMENT
PROPOSAL 3AMENDMENT TO THE MOTOROLA EMPLOYEE STOCK PURCHASEEQUITY COMPENSATION PLAN OF 1999
INFORMATION
The Boardfollowing table summarizes the Company's equity compensation plan information as of Directors believes itDecember 31, 2002. The table does not include information with respect to options assumed in acquisitions where the plans governing the options will not be used for future awards, as described below. The table also does not include information about the proposed 2003 Plan that is inbeing submitted for stockholder approval at the best interests ofannual meeting. No grants have been made under the Company2003 Plan.
| Plan Category | Number of securities to be issued upon exercise of outstanding options and rights (a) | Weighted-average exercise price of outstanding options and rights (b) | Number of securities remaining available for future issuance under equity compensation plans (excluding securities reflected in column (a)) (c) | |||||
|---|---|---|---|---|---|---|---|---|
| Equity Compensation plans approved by Motorola stockholders | 266,737,438 | (1)(2)(3) | $ | 20.40 | 92,090,191 | (4) | ||
| Equity compensation plans not approved by Motorola stockholders(5)(6) | 14,080,774 | (7) | $ | 16.98 | 877,860 | (8) | ||
| Total | 280,818,212 | $ | 20.23 | 92,968,051 | ||||
If our shareholders approve this amendment, an additional 50 million shares will be available for purchase by eligible employees under the Employee Purchase Plan. As of March 15, 2002, the Company had issued and employees had purchased 24,013,592 shares of the original 54.3 million shares authorized under the Employee Purchase Plan. The Company estimates that an additional 8.5 million shares will be issued and purchased for the six-month purchase period ending March 29, 2002. Accordingly, there is the possibility that, without this amendment, there would be insufficient authorized shares for all issuances before the 2003 Annual Meeting. The Company believes that the additional authorized shares will be sufficient for purchases under the plan for approximately three more years.
A summary of the principal features of the Employee Purchase Plan as administered in the U.S. is provided below, but is qualified in its entirety by reference to the full text of the Employee Purchase Plan that was filed electronically with this proxy statement with the Securities and Exchange Commission. Such text is not included in the printed version of this proxy statement. A copy of the Employee Purchase Plan is available from the Company's Secretary at the address on the cover of this document. A copy of the Employee Purchase Plan is available from the Company's Secretary at the address on the cover of this document.
Administration and Eligibility
The Employee Purchase Plan is administered by the Compensation Committee of the Board of Directors (the "Committee"). The Committee has the authority to make rules and regulations governing the administration of the Employee Purchase Plan. The Committee may delegate the administration of the Employee Purchase Plan in accordance with the terms of the plan.
Substantially all full-time employees of the Company and designated subsidiaries are eligible to participate in the Employee Purchase Plan, except that the following may be excluded at the discretion of the Committee: (i) employees whose customary employment is 20 hours or less per week; and (ii) employees whose customary employment is for not more than 5 months per year. As of December 31, 2001, approximately 100,000 employees were eligible to participate in the Employee Purchase2000 Plan and approximately 44,000 employees participate in the Employee Purchase2002 Plan.
Participation and Terms
An eligible employee may elect to participate in the Employee Purchase Plan as of any Enrollment Date. "Enrollment Dates" occur on the first day of the offering period which is currently set at six-month intervals beginning on approximately April 1 and October 1. To participate in the Employee Purchase Plan an employee must complete an enrollment and payroll deduction authorization form provided by the Company which indicates the amounts to be deducted from his or her salary and applied to the purchase of the shares on the Share Purchase Date (as hereinafter defined). The payroll deduction must be within limits set by the Committee.
A payroll deduction account is established for each participating employee by the Company and all payroll deductions made on behalf of each employee are credited to each such employee's respective payroll deduction account. On the last trading day of each offering period (the "Share Purchase Date"), the amount credited to each participating employee's payroll deduction account is applied to purchase as many shares as may be purchased with such amount at the applicable purchase price.
The purchase price for the Shares will not be less than the lesser of 85% of the closing price of shares of Common
PROXY STATEMENT 13
Stock as reported on the New York Stock Exchange (i) on the first trading day of the applicable offering period or (ii) on the Share Purchase Date. Employees may purchase shares through the Employee Purchase Plan only by payroll deductions.
Amendment and Termination
The Board of Directors of the Company may amend the Employee Purchase Plan at any time, provided that if stockholder approval is required for the plan to continue to comply with the requirements of Securities and Exchange Commission Regulation Section 240.16b-3 or Section 423 of the Internal Revenue Code (the "Code"), such amendment shall not be effective unless approved by the Company's stockholders within twelve months after the date of the adoption by the Board of Directors.
The Employee Purchase Plan may be terminated by the Board of Directors at any time.
Federal Income Tax Consequences
The Employee Purchase Plan Each restricted stock unit is intended to be an "employeethe economic equivalent of a share of Common Stock.
If the participant sells or otherwise disposes of the shares within that two-year period, the participant will recognize ordinary income at the time of dispositioneach SAR granted, cash in an amount equal to the excess of the fair market pricevalue of the shares on the date of purchase over the purchase price and the Company will be entitled to a tax deduction for the same amount.
If the participant sells or otherwise disposes of the shares after holding the shares for the two-year period, the participant will recognize ordinary income at the time in an amount equal to the lesser of (i) the excess of the market price of the shares on the first day of the offering period over the purchase price, or (ii) the excess of the market price of the shares at the time of disposition over the purchase price. The Company will not be entitled to any tax deduction with respect to shares purchased under the Employee Purchase Plan if the shares are held for the requisite two-year period.
The employee may also recognize capital gain or loss at the time of disposition of the shares, either short-term or long-term, depending on the holding period for the shares.
Other Information
On March 15, 2002, the closing priceone share of the Common Stock on the date the SAR is exercised over the fair market value of one share of Common Stock on the date the SAR was $14.00.
RECOMMENDATION OF THE BOARD
THE BOARD OF DIRECTORS RECOMMENDS granted. No security is issued upon the exercise of these SARs.
PROPOSAL 4SHAREHOLDER PROPOSAL RE: NON-AUDIT SERVICES BY INDEPENDENT AUDITORS
For reasons stated below, the Board of DirectorsPlan") that was adopted in November 2000. One of the Company recommends a vote "AGAINST" this shareholder proposal.
The Company has been advised that the Sheet Metal Workers' National Pension Fund, 601 North Fairfax Street, Suite 500, Alexandria, Virginia 22314-2075, the beneficial owner of 162,000 shares, intends to submit the following proposal for consideration at the 2002 annual meeting:
RESOLVED, that the shareholders of Motorola, Inc. ("Company") request that the Board of Directors adopt a policy stating that the public accounting firm retained by our Company to provide audit services, or any affiliated company, should not also be retained to provide non-audit services to our Company.
Statement of Support: The role of independent auditors in ensuring the integritymajor purposes of the financial statementsC/A Plan is to grant awards to persons newly hired by the Company, including persons becoming employees as a result of public corporations is fundamentally importantan acquisition transaction; otherwise grants are generally made by the Company under the 1998, 2000 and 2002 Plans noted in footnote 1 above. Awards may not be made under the C/A Plan to the efficient and effective operationdirectors or executive officers of the financial markets.Company. The U.S. Securities and Exchange Commission recently stated:
Independent auditors have an important public trust. Investors must be ableC/A Plan is more fully described below.
It is critically important to the integrity of the auditing process and the confidence of investors that those firms performing audits for public corporations avoid business relationships that might compromise their independence or raise the perception of compromised judgment. At the heart of the challenge to auditor independence is the growing level of business and financial relationships developing between audit firms and their clients. Bulletin #14 identifies these growing business relationships that threaten auditor independence:
Accounting firms have woven an increasingly complex web of business and financial relationships with their
14 PROXY STATEMENT
audit clients. The nature of the non-audit services that accounting firms provide to their audit clients has changed, and the revenues from these services have dramatically increased.
The growth of non-audit revenues represents a trend that has been accelerating dramatically in the last several years, with non-audit fees for consulting or advisory services exceeding audit fees at many companies. Our Company is in the category of companies that pays its audit firm more for non-audit advisory services than it does for audit services. The Company's most recent proxy statement indicated that for fiscal year 2000 KPMG LLP billed $3.9 million for audit services rendered, while it billed $62.3 million for non-audit services rendered.
We believe that this financial "web of business and financial relationships" may at a minimum create the perception of a conflict of interest that could result in a lack of owner and investor confidence in the integrity of the Company's financial statements. As long-term shareowners, we believe that the best means of addressing this issue is to prohibit any audit firm retained by our Company to perform audit services from receiving payment for any non-audit services performed by the firm.
We urge your support for this resolution designed to protect the integrity of the Company's auditing and financial reporting processes.
RECOMMENDATION OF THE BOARD
THE BOARD OF DIRECTORS RECOMMENDS A VOTEAGAINST THIS SHAREHOLDER PROPOSAL FOR THE REASONS BELOW.
Motorola's Board of Directors believes that ensuring the credibility of the Company's financial statements is one of the Board's most important roles. To help ensure this credibility, the Company retains KPMG LLP to perform audit services. The Company also retains KPMG for certain other services that it believes KPMG is best suited to perform. The decision to retain KPMG to perform non-audit services is only made after a determination: (i) that KPMG's particular expertise and/or specific knowledge of the Company and its management and financial systems are likely to yield the best, most timely and most cost-effective results, and (ii) that the engagement is consistent with the maintenance of auditor independence. In 2001, the primary non-audit services provided by KPMG were tax services, consisting of tax compliance in the U.S. and overseas, advice on tax planning, advice on transfer pricing issues, and tax assistance for expatriate employees.
The Board of Director's Audit and Legal Committee reviews whether the provision of non-audit services by KPMG is compatible with maintaining auditor's independence and reports to the full Board on auditor independence. The Committee's governance policy requires that all engagements are based on independence and expertise; that all auditor independence requirements of the Securities and Exchange Commission are met; that the Company follows The American Institute of Certified Public Accountants' guidelines for auditor independence; and that the Committee reviews all engagements.
As indicated by the proponent, in 2000 KPMG billed the Companypurchase a total of $3.9 million for audit services7,452,379 shares of Common Stock had been assumed by the Company in connection with acquisition transactions, at a weighted average exercise price of $10.85. These options were issued under equity compensation plans of companies acquired by Motorola. No additional options may be granted under these equity compensation plans. The table does not include information with respect to these assumed options.
The Committee also has mandated that the Company's auditors may not provide IT consulting, internal audit services or financial transaction structuring services in the future. Further, the Committee has determined that KPMG will not provide tax assistance for expatriate employees after the completion of 2001 tax returns.
Given the protective policies already in place, the Company does not believe it is necessary to place an arbitrary limitation on senior management, the Audit and Legal Committee and the Board of Directors in exercising their business judgment for the selection of auditors or other outside vendors. The Board of Directors believes that they should retain discretion to engage KPMG to perform non-audit services that they are best suited to perform, and that such discretion is consistent with auditor independence.
PROPOSAL 5SHAREHOLDER PROPOSAL RE: DISCLOSURE OF THE BOARD'S ROLE IN DEVELOPING AND MONITORING THE COMPANY'S STRATEGY
For reasons stated below, the Board of Directors of the Company recommends a vote "AGAINST" this shareholder proposal.
The Company has been advised that The Carpenters Pension and Annuity Fund of Philadelphia and Vicinity, 1803 Spring Garden Street, Philadelphia, Pennsylvania 19130, the beneficial owner of 28,200 shares, intends to submit the following proposal for consideration at the 2002 annual meeting:
RESOLVED, that the shareowners of Motorola, Inc. ("Company") hereby urge that the Board of Directors prepare a description of the Board's role in the development and monitoring of the Company's long-term strategic plan. Specifically, the disclosure should include the following: (1) a description of the Company's corporate strategy development process, including timelines; (2) an outline of the
PROXY STATEMENT 15
specific tasks performed by the Board in the strategy development and the compliance monitoring processes, and (3) a descriptionThe Compensation/Acquisition Plan of the mechanisms in place to ensure director access to pertinent information for informed director participation in the strategy development and monitoring processes. This disclosure of the Board's role in the strategy development process should be disseminated to shareowners through appropriate means, whether it be posted on the Company's website or sent via a written communication to shareowners.
Statement of Support: The development of a well-conceived corporate strategy is critical to the long-term success of a corporation. While senior management of our Company is primarily responsible for development of the Company's strategic plans, in today's fast-changing environment it is more important than ever that the Board engage actively and continuously in strategic planning and the ongoing assessment of business opportunities and risks. It is vitally important that the individual members of the Board, and the Board as an entity, participate directly and meaningfully in the development and continued assessment of our Company's strategic plan.
A recent report by PricewaterhouseCoopers entitled "Corporate Governance and the Board—What Works Best" examined the issue of director involvement in corporate strategy development. The Corporate Governance Report found that chief executives consistently rank strategy as one of their top issues, while a poll of directors showed that board contributions to the strategic planning process are lacking. It states: "Indeed, it is the area most needing improvement. Effective boards play a critical role in the development process, by both ensuring a sound strategic planning process and scrutinizing the plan itself with the rigor required to determine whether it deserves endorsement."
The Company's proxy statement provides biographical background information on each director, indicating his or her compensation, term of office, and board committee responsibilities. While this information is helpful in assessing the general capabilities of individual directors, it provides shareholders no insight into how the directors, individually and as a team, participate in the critically important task of developing the Company's operating strategy. And while there is no one best process for board involvement in the strategy development and monitoring processes, shareholder disclosure on the Board's role in strategy development would provide shareholders information with which to better assess the performance of the board in formulating corporate strategy. Further, it would help to promote "best practices" in the area of meaningful board of director involvement in strategy development.
We urge your support for this important corporate governance reform.
THE RECOMMENDATION OF THE BOARD
THE BOARD OF DIRECTORS RECOMMENDS A VOTEAGAINST THIS SHAREHOLDER PROPOSAL FOR THE REASONS BELOW.2000
The Company already provides a meaningful descriptionCompensation/Acquisition Plan of the Board's role in developing and monitoring the Company's strategic plans. For example, in the Company's proxy statement for its annual shareholder meeting2000 (the "C/A Plan"), initially adopted on MayNovember 7, 2001, the following paragraph appeared in the Special Report of the Board:
"A Board meeting at the beginning of each year will be solely devoted to reviewing the Company's short-term and long-term strategies. At each subsequent meeting, the Board will follow-up with each significant business to ensure that the business is meeting its commitments or revising its strategies in response to market conditions."
In this year's proxy statement, the following paragraph appears under the heading "Meetings of2000 by the Board of Directors, provides that awards may be granted to employees of the Company":
"As partCompany and its subsidiaries who are not executive officers or directors of its renewal process, the Board previously committed to devote entire meetings to reviewing the Company's short-term and long-term strategies. The Board met this commitment and devoted a great deal of time to reviewing the Company's strategy during 2001. That focus will continue in 2002. In addition to reviewing the Company's strategy, the Board also followed-up with each significant business during the year to ensure that the business was meeting its commitments or adjusting those strategies to respond to the dynamic market conditions during the year."
As these paragraphs illustrate, the Company, already provides shareholdersin connection with a meaningful descriptionits recruiting and retention efforts. One of the rolemajor purposes of the Board with respectC/A Plan is to the company's short- and long-term strategies. Further,grant awards to persons newly hired by the Company, has demonstrated that there isincluding persons becoming employees as a process in place for Board oversight and a timeline for Board review.result of an acquisition transaction. In 2002, substantially all of the awards granted under this plan were to new employees. Existing employees received grants under our shareholder approved plans.
The Company agreesC/A Plan permits the granting of stock options, stock appreciation rights, restricted stock and restricted stock units, performance stock, performance units and other stock awards. Although when initially adopted the C/A Plan provided for a maximum of 40,000,000 shares of Common Stock to be issued under the C/A Plan, subject to certain adjustments, the C/A Plan was amended to provide that, in lieu of such share authorization, the Committee that administers the C/A Plan has the authority to determine from time to time the maximum number of shares of Common Stock reserved for issuance under the C/A Plan. As of December 31, 2002, the maximum number of shares authorized to be issued under the C/A Plan is 2,000,000.
The C/A Plan is administered by the Compensation and Leadership Committee of the Motorola Board. Awards have included options to acquire shares of the Company's common stock and restricted stock ("Restricted Stock"). Each option granted has an exercise price of 100% of the market value of the Common Stock on the date of grant. Generally, all options expire 10 years from the date of grant and vest and become exercisable at 25% increments over four years, with the proponent that, "[i]t is vitally important that the individual membersexception of grants made on January 3, 2001 as part of the Board,Chairman's Challenge grant which vested and became exercisable on July 1, 2003 and expire on May 3, 2003. Awards of Restricted Stock consist of shares or the Board as an entity, participate directlyrights to shares of the Company's common stock. These awards are restricted such that they are subject to substantial risk of forfeiture and meaningfully in the development and continued assessment of our Company's strategic plan." As demonstratedto restrictions on their sale or other transfer by the information above,employee. Generally, Restricted Stock vests in 25% increments over four years, starting on the Board already works closely with senior management to establish and monitor the Company's short-term and long-term strategies.
The Company also believes that it is important for its shareholders to understand the Board's general role in strategy development. That is why the Company includes informationsecond anniversary of the type highlighted aboveaward.
Upon the occurrence of a change in its proxy statements. However, requiring periodic reportingcontrol, each stock option outstanding on the date on which the change in control occurs, will immediately become exercisable in full. In addition, the restrictions on all shares of restricted stock and restricted stock units outstanding on the Board's roledate on which the change in the strategic process of the extremely specific nature called for by the resolution is not prudent for two important reasons.
The Company's primary strategic goal is to increase shareholder value. The specific strategies for achieving that goal must rapidly evolve to meet changing circumstances in the numerous markets that the Company serves. The constant production of specific reports as called for by the resolution would not aid this process but rather could hinder it by reducing management's flexibility to quickly react to changing circumstances.
Second, the Company considers its strategy development process an important corporate asset and a key competitive advantage. Making information of the type requested by the resolution publicly available would erode this competitive advantage by allowing competitors to monitor and copy the Company's strategy and strategy development processes.control occurs will be automatically terminated.
16 PROXY STATEMENT
OWNERSHIP OF SECURITIES
The following table sets forth information as of January 31, 20022003, except as noted below, regarding the beneficial ownership of shares of Common Stock by each director and nominee for director of the Company, by the persons named in the Summary Compensation Table on page 19, and by all current directors, nominees and executive officers of the Company as a group. Each director owns less than 1% of the Common Stock. All current directors, nominees and current executive officers as a group own 1.3%1.2%.
| Name | Shares Owned (1) | Shares Under Exercisable Options (2) | Total Shares Beneficially Owned (3)(4) | Shares Owned(1) | Shares Under Exercisable Options(2) | Total Shares Beneficially Owned(3)(4) | |||||||
|---|---|---|---|---|---|---|---|---|---|---|---|---|---|
| Christopher B. Galvin | 14,048,014 | 2,667,000 | 16,716,261 | (5) | 15,218,811 | 2,877,000 | 18,097,078(5) | ||||||
| Robert L. Growney | 389,916 | 2,954,500 | 3,344,416 | (6) | |||||||||
| Edward D. Breen | 535,687 | 1,591,137 | 2,132,200 | (7) | |||||||||
| Carl F. Koenemann | 95,674 | 1,170,930 | 1,277,068 | (8) | |||||||||
| Keith J. Bane | 75,930 | 657,500 | 813,150 | (9) | |||||||||
| Mike S. Zafirofski | 1,041,860 | 650,000 | 1,691,860(6) | ||||||||||
| David W. Devonshire | 0 | 100,000 | 120,225(7) | ||||||||||
| Robert L. Barnett | 21,418 | 1,288,750 | 1,311,165 | ||||||||||
| Thomas J. Lynch | 65,423 | 516,547 | 585,672(8) | ||||||||||
| Francesco Caio | 4,270 | 0 | 4,270 | 9,612 | 15,000 | 24,612(9) | |||||||
| Ronnie C. Chan | 51,927 | 22,500 | 74,427 | (10) | |||||||||
| H. Laurance Fuller | 35,793 | 40,500 | 76,293 | (11) | 41,084 | 55,500 | 96,584(10) | ||||||
| Anne P. Jones | 12,624 | 40,500 | 55,436 | (12) | 9,066 | 55,500 | 73,464(11) | ||||||
| Judy C. Lewent | 25,356 | 40,500 | 65,856 | (13) | 31,058 | 55,500 | 86,558(12) | ||||||
| Walter E. Massey | 15,150 | 33,000 | 48,150 | (14) | 18,074 | 48,000 | 66,074(13) | ||||||
| Nicholas Negroponte | 33,870 | 40,500 | 74,370 | 44,161 | 55,500 | 99,661(14) | |||||||
| Indra K. Nooyi | 2,451 | 0 | 2,451(15) | ||||||||||
| John E. Pepper, Jr. | 31,449 | 40,500 | 84,999 | (15) | 45,385 | 55,500 | 113,935(16) | ||||||
| Samuel C. Scott III | 27,870 | 40,500 | 68,370 | (16) | 30,780 | 55,500 | 86,280(17) | ||||||
| Douglas A. Warner III | 0 | 0 | 0 | 22,124 | 0 | 22,124(18) | |||||||
| B. Kenneth West | 36,984 | 40,500 | 77,484 | (17) | 42,882 | 55,500 | 98,382(19) | ||||||
| John A. White | 29,005 | 22,500 | 51,505 | (18) | 32,724 | 37,500 | 70,224(20) | ||||||
| All current directors, nominees and current executive officers as a group (27 persons) | 16,478,346 | 14,081,149 | 30,702,395 | (19) | 17,010,137 | 10,510,582 | 27,808,045(21) | ||||||
PROXY STATEMENT 17
PROXY STATEMENT 17
As of December 31, 2001,2002, no person was known by the Company to be the beneficial owner of more than 5% of the Company's Common Stock, except that FMR Corp. filed a Schedule 13G with the Securities and Exchange Commission containing the following information:
| Name and Address | Number of Shares and Nature of Beneficial Ownership | Percent of Class | |||
|---|---|---|---|---|---|
| FMR Corp. 82 Devonshire Street Boston, MA 02109 | of Common Stock(1) | % |
18 PROXY STATEMENT
EXECUTIVE COMPENSATION
| | Annual Compensation | | | | | |||||||||||
|---|---|---|---|---|---|---|---|---|---|---|---|---|---|---|---|---|
| | Long-Term Compensation | | ||||||||||||||
| | | | | Other Annual Compen- sation ($)(3)(4) | | |||||||||||
| Name and Principal Position | Year | Salary ($)(1) | Bonus ($)(2) | Restricted Stock Awards ($) | Securities Underlying Options (#)(5) | LTIP Payouts ($)(6) | All Other Compen- sation ($)(7) | |||||||||
| Christopher B. Galvin Chairman of the Board and Chief Executive Officer | 2002 2001 2000 | 1,275,000 1,275,000 1,275,000 | 1,500,000 0 1,250,000 | 12,845 5,232 6,281 | 0 0 0 | 1,000,000(8) 900,000(8) 0 | 0 0 0 | 9,552(9) 7,328 8,299(9) | ||||||||
Mike S. Zafirovski President and Chief Operating Officer | 2002 2001 2000 | 810,577 746,154 402,500 | 750,000 1,000,000(13) 1,150,000(13) | 113,182(10) 170,413(10) 110,333(10) | 5,450,000(11) 0 18,306,000(13) | 800,000(11)(12) 650,000(14) 750,000(13) | 650,000(13) 0 0 | 5,946 1,502 820 | ||||||||
David W. Devonshire Executive Vice President and Chief Financial Officer | 2002 | 442,308 | 627,500(15) | 85,910(16) | 280,000(15) | 400,000(15) | 0 | 3,019 | ||||||||
Robert L. Barnett Executive Vice President | 2002 2001 2000 | 560,000 560,000 560,000 | 390,000 400,000 550,000 | 2,625 2,688 3,059,023(18) | 0 0 0 | 300,000(17) 378,500(17) 0 | 0 0 0 | 10,766 10,969 7,427 | ||||||||
Thomas J. Lynch Executive Vice President | 2002 2001 2000 | 505,384 438,464 277,083 | 790,000(19) 225,000 807,922(23) | 399,308(20) 90,985(20) 53,136(20) | 590,000(21) 0 1,018,800(19) | 450,000(21)(22) 286,500(22) 195,000(19) | 0 0 0 | 4,842 4,927 5,156 | ||||||||
PROXY STATEMENT 19
career as long as he isa life insurance policy for elected officers, the use of company aircraft and relocation benefits, and (ii) Company perk costs for Mr. Zafirovski of $89,075, including $70,256 in relocation benefits.
20 PROXY STATEMENT
income the amount of any contribution in the year it was made, even though the participant receives no cash in connection with such contribution or any payments from the retirement plan. Because the participant receives no cash yet incurs a significant income tax liability, the Company believes that it is appropriate to reimburse the participant so that he or she is not paying additional taxes as a result of the contribution. In 2000, Mr. Barnett was reimbursed for such a tax liability of $3,057,117.
20 PROXY STATEMENT 21
Stock Option Grants in 20012002
| Individual Grants | | | ||||||||||
|---|---|---|---|---|---|---|---|---|---|---|---|---|
| Potential Realizable Value (2) at Assumed Annual Rates of Stock Price Appreciation for Option Term | ||||||||||||
| | Number of Securities Underlying Options Granted (# of shares)(1) | | | | ||||||||
| | % of Total Options Granted to Employees in 2001 | | | |||||||||
| | Exercise or Base Price ($/Sh) | | ||||||||||
| | Expiration Date | |||||||||||
| Name | 5%($)(2) | 10%($)(2) | ||||||||||
| Christopher B. Galvin | 900,000 | (3) | 1.1 | % | 14.41 | 3/16/11 | (8) | 8,156,134 | 20,669,246 | |||
| Robert L. Growney | 825,000 | (4) | 1.0 | % | 14.41 | 3/16/11 | (8) | 7,850,279 | 18,946,809 | |||
| Edward D. Breen | 500,000 300,000 200,000 | (5) (3) (6) | 0.6 0.4 0.2 | % % % | 22.35 14.41 14.41 | 12/3/03 3/16/11 3/16/11 | (9) (8) (8) | 1,710,124 2,718,711 1,812,474 | 12,265,845 6,889,749 4,593,166 | |||
| Carl F. Koenemann | 150,000 | (7) | 0.2 | % | 14.41 | 3/16/11 | (8) | 1,359,356 | 3,444,874 | |||
| Keith J. Bane | 200,000 178,500 | (3) (5) | 0.2 0.2 | % % | 14.41 22.35 | 3/16/11 12/3/03 | (8) (9) | 1,812,474 610,514 | 4,593,166 4,378,907 | |||
| Individual Grants | | | ||||||||||
|---|---|---|---|---|---|---|---|---|---|---|---|---|
| Potential Realizable Value(2) at Assumed Annual Rates of Stock Price Appreciation for Option Term | ||||||||||||
| | Number of Securities Underlying Options Granted (# of shares)(1) | | | | ||||||||
| | % of Total Options Granted to Employees in 2002 | | | |||||||||
| | Exercise or Base Price ($/Sh) | | ||||||||||
| | Expiration Date | |||||||||||
| Name | 5%($)(2) | 10%($)(2) | ||||||||||
| Christopher B. Galvin | 1,000,000(3)(4) | 1.0 | 14.44 | 5/7/12(5) | 9,081,238 | 23,013,641 | ||||||
Mike S. Zafirovski | 600,000(3)(4) 200,000(6)(7) | 0.6 0.2 | 14.44 10.90 | 5/7/12(5) 7/29/12(8) | 5,448,743 1,370,990 | 13,808,185 3,474,359 | ||||||
David W. Devonshire | 400,000(3)(9) | 0.4 | 14.00 | 3/18/12(8) | 3,521,810 | 8,924,958 | ||||||
Robert L. Barnett | 300,000(3)(10) | 0.3 | 14.44 | 5/7/12(5) | 2,724,372 | 6,904,092 | ||||||
Thomas J. Lynch | 250,000(3)(4) 200,000(6)(11) | 0.2 0.2 | 14.44 11.80 | 5/7/12(5) 8/9/12(8) | 2,270,310 1,484,191 | 5,753,410 3,761,232 | ||||||
22 PROXY STATEMENT 21
Aggregated Option Exercises in 20012002
and 20012002 Year-End Option Values
| | | | Number of Securities Underlying Unexercised Options at end of 2001(#) | Value of Unexercised In-The-Money (2) Options at end of 2001($)(3) | ||||||||
|---|---|---|---|---|---|---|---|---|---|---|---|---|
| | Shares Acquired on Exercise (# of shares) | Value Realized ($)(1) | ||||||||||
| Name | Exercisable | Unexercisable | Exercisable | Unexercisable | ||||||||
| Christopher B. Galvin | 168,000 | 2,732,156 | 2,217,000 | 1,575,000 | 1,555,620 | 549,000 | ||||||
| Robert L. Growney | 0 | 0 | 1,523,250 | 1,443,750 | 0 | 503,250 | ||||||
| Edward D. Breen | 0 | 0 | 1,347,387 | 1,506,250 | 5,594,084 | 305,000 | ||||||
| Carl F. Koenemann | 0 | 0 | 1,038,930 | 132,000 | 105,203 | 0 | ||||||
| Keith J. Bane | 0 | 0 | 543,750 | 569,750 | 0 | 122,000 | ||||||
| | | | Number of Securities Underlying Unexercised Options at end of 2002(#) | Value of Unexercised In-The-Money(2) Options at end of 2002($)(3) | ||||||||
|---|---|---|---|---|---|---|---|---|---|---|---|---|
| | Shares Acquired on Exercise (# of shares) | Value Realized ($)(1) | ||||||||||
| Name | Exercisable | Unexercisable | Exercisable | Unexercisable | ||||||||
| Christopher B. Galvin | 240,000 | 568,800 | 2,427,000 | 2,125,000 | 0 | 0 | ||||||
| Mike S. Zafirovski | 0 | 0 | 650,000 | 1,550,000 | 0 | 0 | ||||||
| David W. Devonshire | 0 | 0 | 0 | 400,000 | 0 | 0 | ||||||
| Robert L. Barnett | 0 | 0 | 1,175,000 | 277,500 | 0 | 0 | ||||||
| Thomas J. Lynch | 0 | 0 | 430,297 | 660,000 | 5,209 | 0 | ||||||
Long-Term Incentive Plans-AwardsPlans—No Awards in 20012002
| | | Estimated Future Payouts Under Non-Stock Based Plans | ||||
|---|---|---|---|---|---|---|
| | Performance or Other Period Until Maturation or Payout Maximum | |||||
| | (1)(2)(3) | |||||
| Name | Target ($)(4)(5) | Maximum ($) | ||||
| Christopher B. Galvin | 3 Years | 1,275,000 | 2,550,000 | |||
| Robert L. Growney | 3 Years | 975,000 | 1,950,000 | |||
| Edward D. Breen | 3 Years | 650,000 | 1,300,000 | |||
| Carl F. Koenemann | 3 Years | 570,000 | 1,140,000 | |||
| Keith J. Bane | 3 Years | 341,250 | 682,500 | |||
The 3-year cycle that otherwise would have started on January 1, 2002, has been suspended as As a measure to reduce costs and return to profitability as quickly as possible. The 3-year cycles currently in progress will continue throughpossible, the cycle end dates in 2002 and 2003. A new cycle is expected to begin on January 1, 2003, assuming appropriate business conditions. There have been no payouts under New LRIP or its predecessor plan, since 1997.
22 PROXY STATEMENT will not occur.
The Motorola, Inc. Pension Plan (the "Pension Plan") may provide pension benefits to the named executive officers in the future. Most regular U.S. employees who have completed one year of employment with the Company or certain of its subsidiaries are eligible to participate in the Pension Plan. They become vested after five years of service. Normal retirement is at age 65.
The Company also maintains a supplementary retirement plan (the "SRP Plan") for certain elected officers. Since January 1, 2000, no additional officers are eligible for participation in the SRP. Elected officers, including four of the executive officers named in the Compensation Table,Mr. Galvin and Mr. Barnett, who, prior to January 1, 2000, were designated for Participationparticipation by the Committee administering the plan or who attained age 55 or became disabled.SRP Plan, participate in the SRP Plan. Mr. Breen doesDevonshire, Mr. Lynch and Mr. Zafirovski do not participate in this supplementary retirement plan.the SRP Plan. The planSRP Plan provides that if the benefit payable annually (computed on a single life annuity basis) to any participating officer under the Pension Plan (which is generally based on varying percentages of specified amountsa percentage of final average earnings prorated for service, as described in the Pension Plan)each year of service) is less than the benefit calculated under the supplementary plan,SRP Plan, that officer will receive supplementary payments upon retirement.
Generally, the total annual payments to such officer from both plans will equal a percentage of the sum of such officer's rate of salary at retirement plus an amount equal to the highest average of the annual bonus awards paid to such officer for any five years within the last eight years preceding retirement. Such percentage ranges from 40% to 45%, depending upon such officer's years of service and other factors. Under an alternate formula, the total annual payments to such officer from both plans will equal the amount of the officer's retirement benefit calculated under the terms of the Pension Plan, without regard to the limitation on considered compensation under qualified retirement plans in section 417 of the Internal Revenue Code (the "Code") or the technical benefits limitation in section 415 of the Code. However, the total annual pension payable on the basis of a single life annuity to any named executive officer from the Pension Plan and supplementary retirement planSRP Plan is subject to a maximum of 70% of that officer's base salary prior to retirement. If the officer is vested and retires at or after age 55 but prior to age 60, he or she may elect to receive a deferred unreduced benefit when he or she attains age 60, or an actuarially reduced benefit at or after age 57, contingent upon entering into an agreement not to compete with the Company. If a change in control (as defined) of the Company occurs, the right of each non-vested elected officer to receive supplementary payments will become vested on the date of such change in control and unreduced payments may begin or be made upon retirement at or after age 55.
Participants in the supplementary retirement planSRP Plan generally become vested in the plan at age 55 with 5 years of service, or at age 60 with two years of service, or at age 65 or upon becoming disabled (without regard to years of service). At the time of vesting the Company makes a contribution to the trust for that plan. The purpose of that contribution is to enable the
PROXY STATEMENT 23
trust to make payments of the benefits under the supplementary retirement planSRP Plan due to the participant after retirement. Federal and state tax laws require that the participant include in income the amount of any contribution in the year it was made even though the participant receives no cash in connection with such contribution or any payments from the retirement plan. Because the participant receives no cash yet incurs a significant income tax liability, the Company believes that it is appropriate to reimburse the participant so that he or she is not paying additional taxes as a result of a contribution. As described in the Summary Compensation Table, Mr. Barnett was reimbursed for such a tax liability of $3,057,117 in 2000. This is the Company's policy with respect to all participants in the plan, including those named in the Summary Compensation Table.
Based on salary levels at December 31, 2001,2002, and the average of the MEIP or PE=Rannual incentive awards paid for the highest five years out of the last eight years, for the named executive officers in the Summary Compensation Table, the estimated annual benefit payable upon retirement at normal retirement age from the Pension Plan, as supplemented pursuant to the officers' supplementary retirement plan described aboveSRP Plan and a previous retirement income plan,plans (including plans of the former General Instrument Corporation for Mr. Lynch), if applicable, isare as follows: Mr. C. Galvin, $1,045,706;$1,045,606; Mr. Growney, $785,400;Zafirovski, $56,476; Mr. Breen $315,474;Devonshire, $2,069; Mr. Koenemann, $469,000;Barnett, $399,840; and Mr. Bane, $318,500.Lynch, $109,160.
In addition, as part of the compensation arrangements agreed to with Mr. Zafirovski when he joined the Company in 2000, the Company agreed to make a deferred cash payment of $4 million plus accrued interest to Mr. Zafirovski when he reaches age 60. The Company agreed to this payment in order to replace the supplemental retirement benefit that Mr. Zafirovski had accrued with his former employer that was forfeited when he joined the Company. The Company accrues interest quarterly on this amount, at the rate of 7% per annum, from Mr. Zafirovski's start date until he is age 60. In the event of Mr. Zafirovski's death before age 60, the amount credited to his account at the date of death, plus any interest accrued from the last day of the preceding calendar quarter to the date of payment, shall be payable as designated by Mr. Zafirovski. In the event of any other termination of Mr. Zafirovski's employment or a change in control before Mr. Zafirovski reaches age 60, the balance of his account on the date of termination or change in control, plus any interest accrued from the last day of the preceding calendar quarter to the date of payment, will be paid to Mr. Zafirovski in a lump sum.
EMPLOYMENT CONTRACTS, TERMINATION OF EMPLOYMENT AND CHANGE IN CONTROL ARRANGEMENTS
Severance Protection Agreement with Thomas Lynch
In connection with the Company's acquisition of General Instrument Corporation in January 2000, the Company entered into an Amendment to Severance Protection Agreement (as further amended, the "Severance Agreement") with Thomas J. Lynch, a former Senior Vice President of General Instrument Corporation and the current President of the Company's Personal Communications Sector. The Severance Agreement was entered into with Mr. Lynch as an added benefit to retain his services after the acquisition. The Severance Agreement terminated on January 12, 2002.
Pursuant to the Severance Agreement, on January 12, 2000, Mr. Lynch was granted: (i) options to purchase 195,000 shares of Common Stock and (ii) 22,500 shares of restricted stock. The 195,000 options have an exercise price of $45.28, the fair market value on the date of grant. Each of these grants is discussed in the Summary Compensation Table. The options become exercisable in equal annual installments over 4 years, with the first installment vesting on January 12, 2001, and expire on January 12, 2015. The restrictions on the 22,500 shares of restricted stock lapsed on January 12, 2002. Pursuant to the Severance Agreement, Mr. Lynch was also promised options to purchase at least 45,000 shares of Common Stock as part of the Company's traditional annual stock option grants during 2001. These options were granted to Mr. Lynch on March 16, 2001 and have an exercise price of $14.41, the fair market value on the date of grant. These options become exercisable in equal annual installments over 4 years, with the first installment vesting on March 16, 2002, and expire on March 16, 2011.
Pursuant to the terms of the Severance Agreement, Mr. Lynch was also granted the conditional right to receive a one-time retention bonus if he remained employed by Motorola for two years after the acquisition. On January 4, 2002, Mr. Lynch received this cash payment of $546,363 (equal to $385,000, plus a tax reimbursement payment to offset the impact of resulting income tax liability).
The Severance Agreement provided for severance pay and other benefits under certain conditions in the event of a termination of employment within 24 months of a "Change of Control"(as defined in the Severance Agreement). When the Severance Agreement terminated on January 12, 2002, Mr. Lynch became subject to the Change in Control Severance Plans for Motorola's elected officers described below.
24 PROXY STATEMENT
Severance Agreement with David Devonshire
In March 2002, the Company entered into compensation arrangements with David Devonshire as an incentive for him to join the Company as Chief Financial Officer. Pursuant to the compensation arrangements, if Mr. Devonshire is terminated without cause Motorola has agreed to pay him severance equal to one year's base salary plus his targeted incentive payout.
Change in Control Arrangements
The Company has adopted Change in Control Severance Plans (the "Plans") for its elected officers. The Plan applicable to the named executive officers is the Motorola, Inc. Senior Officer Change in Control Severance Plan (the "Senior Officer Plan"). The Senior Officer Plan provides for the payment of benefits in the event that: (i) an executive officer terminates his or her employment for "good reason" (as defined) within two years of a change in control, or (ii) the executive officer's employment is terminated for any reason other than termination for "good cause" (as defined), disability, death or normal retirement within two years of a change in control. In addition to unpaid salary for accrued vacation days and accrued salary and annual bonus through the termination date, the amount of the benefits payable to an executive officer entitled thereto would be equal to the sum of: (i) three times the greater of the executive officer's highest annual base salary in effect during the three years immediately preceding the change in control and the annual base salary in effect on the termination date; (ii) three times the highest annual bonus received by the executive officer during the immediately preceding five fiscal years ending on or before the termination date; and (iii) a pro rata target bonus for the year of termination. The executive officer would also receive continued medical and insurance benefits for 3 years, and 3 years of age and service credit for retiree medical eligibility. In the event the executive officer is subject to the excise of tax under Section 4999 of the Internal
PROXY STATEMENT 23
Revenue Code, the Company will make a tax reimbursement payment to the executive officer to offset the impact of such excise tax. The Senior Officer Plan's term is for 3 years, subject to automatic one-year extensions unless the Company gives 90 days prior notice that it does not wish to extend. In addition, if a change in control occurs during the term, the Plans continue for an additional two years. These Plans replace individual agreements that the Company began providing in 1988.
Employment Agreement with Edward Breen
In connection with the Company's acquisition of General Instrument Corporation in January 2000, the Company entered into an Amendmentaddition to Employment Agreement (as further amended, the "Employment Agreement") with Edward Breen, the former Chairman and Chief Executive Officer of General Instrument Corporation. The Employment Agreement was entered into with Mr. Breen as an added benefit to retain his services after the merger. As of January 1, 2002, Mr. Breen became the President and Chief Operating Officer of the Company.
Pursuant to the Employment Agreement, on January 12, 2000, Mr. Breen was granted: (i) options to purchase 675,000 shares of Common Stock and (ii) 75,000 shares of restricted stock. The 675,000 options have an exercise price of $45.28, the fair market value on the date of grant. Each of these grants are discussed above in the "Summary Compensation Table". The options become exercisable in equal annual installments over 4 years, with the first installment vesting on January 12, 2001, and expire on January 12, 2015. The restrictions on the 75,000 shares of restricted stock lapsed on January 12, 2002. Pursuant to the Employment Agreement, Mr. Breen was also promised a grant of options to purchase at least 300,000 shares of Common Stock as partplans covering all of the Company's traditional annual stock option grants during 2001, which were granted on March 16, 2001 with an exercise price of $14.41,officers, the fair market value on the date of grant. These options become exercisablegeneral employee population is covered by a change in equal annual installments over 4 years, with the first installment vesting on March 16, 2002, and expire on March 16, 2011.
Pursuant to the terms of the Employment Agreement, Mr. Breen was also granted the conditional right to receive a one-time retention bonus if he remained employed by Motorola for two years after the merger. On January 4, 2002, Mr. Breen received this cash payment of $1,697,272 (equal to $1,196,000, plus a tax reimbursement payment to offset the impact of resulting income tax liability). Mr. Breen was also promised a Base Salary of no less than $650,000 annually in his capacity as Executive Vice President and President, Broadband Communications Sector of the Company.control severance plan.
The following "Report of Compensation Committee on Executive Compensation", "Report of Audit and Legal Committee" and "Performance Graph" and related disclosure shall not be deemed incorporated by reference by any general statement incorporating this proxy statement into any filing under the Securities Act of 1933 or under the Securities Exchange Act of 1934, except to the extent that the Company specifically incorporates this information by reference, and shall not otherwise be deemed filed under such Acts.
REPORT OF COMPENSATION COMMITTEE ON EXECUTIVE COMPENSATION
On February 4, 2003, as a result of the work of the 2002 Ad Hoc Committee on Governance, the Board's former Compensation Committee and former Management Development Committee were combined to form the Compensation and Leadership Committee. Beginning in May 2003, the members of the new, combined committee will be Directors Samuel C. Scott III (Chair), Indra K. Nooyi, Douglas A. Warner III and B. Kenneth West. At December 31, 2002 and throughout 2002, the members of the Compensation Committee were Directors Samuel C. Scott III (Chair), H. Laurance Fuller and John E. Pepper, Jr. This report was prepared by the three members of the 2002 Compensation Committee.
The Compensation and Leadership Committee is responsible for administering the Company's executive compensation policies and programs. The Committee recommends compensation for members of the Office of the Chairman to the Board of Directors and reviews compensation for all electedexecutive officers. In carrying out its duties, the Committee has direct access to independent compensation consultants and outside survey data. The Committee reports regularly to the Board of Directors on its activities. TheDuring 2002, the Committee iswas comprised of 3 outside directors who are each independent as defined under the New York Stock Exchange listing standards. During 2003, the Committee will be comprised of 4 independent directors.
Objectives of Executive Compensation Program
Motorola's executive compensation program is designed to attract and retain key executives critical to the long-term success of the Company. The design is centered aroundon three focal points - points—a) providing competitive base pay, b) modulating compensation in line with performance and c) generating outstanding returns to shareholders over the long term. The program was recently redesignedis designed to create strongerstrong links to performance and shareholder value.
Summary of Motorola Compensation Plans
Base Pay
Base pay levels are compared to a competitive peer group within each country and region.group. In the U.S., the peer group consists of 2223 companies which, in the aggregate, the Committee believes fairly represent the Motorola portfolio of businesses.businesses and which the Company competes with for executive talent. Outside the U.S., the same peer group companies are compared unless other, more compelling competitors for executive talent are present.
PROXY STATEMENT 25
Overall, base salary levels for each executive position are set at the 50th percentile of similar positions in the competitive peer group. When a position does not readily match those found in the data, judgment is applied to determine a fair competitive salary. Some variation above and below the competitive median is allowed when, in the judgment of management and the Committee, the value of the individual's experience, performance and specific skill set justifies variation. Variations are permitted in order to place more emphasis on performance-related rewards that generate significant income to those individuals and businesses that demonstrate their ability to produce strong results. In this way, competitively-
24 PROXY STATEMENT
superiorcompetitively-superior pay goes to those that earn it. As a result, the greatest retention value has been invested in the strongest performers.
In addition to base pay, the major executive compensation programs are as follows:
1. The Motorola Incentive Plan (MIP): MIP was initiated in January 2002 and applies to every employee in the Company (except those on a Sales Incentive Plan). The Plan replaced the Performance Excellence Equals Rewards Plan, or PE=R, includeswhich was established primarily for Company officers. MIP focuses on profit before tax (PBT) and free cash flow, two measures critical to improving shareholder returns. PBT and free cash flow targets are established for the Company and each of its major sectors. While most employees are rewarded based on sector performance, high-level elected and appointed vice presidentsofficers (including the executives named in the Summary Compensation Table), as well as employees at certain levels have a significant portion of managementtheir award based on the PBT and specific professionals who are deemed individual contributors. In 2001, approximately 1,000 employees were eligible for an award under PE=R.cash flow of the entire Company.
PE=R is tied to the Company's Performance Excellence program. AwardsMIP awards are paid based on attainment of PBT and free cash flow along with an assessment of each individual's target award, personal performance and his or her business' Performance Excellence Scorecard score. Targetsfor the year. Target awards under PE=RMIP are based on market-competitive data and are established as a percentage of base salary. The Compensation and Leadership Committee designates target levels for members of the Office of the Chairman and other executive officers. They also review target levels for all participants.
2. The second program is the Long Range Incentive Plan: The Long Range Incentive Plan was redesigned for implementation in January of 2000 ("New LRIP"). In 2001, 82 of the Company's most senior electedThe program is offered to approximately 60 high-level executive officers (including the executives named in the Compensation Table) were eligible for awards, but. Payouts under the Plan are based 100% on the Corporation's Total Shareholder Return as defined below:
| TSR = | Change in Stock Price + Dividends Stock price at the beginning of a cycle |
The Company's performance is compared to the performance of its peers. Awards will be paid based on TSR and how the Company has performed relative to its peers.
Other than a guaranteed minimum payment to Mr. Zafirovski (which is described further under "Office of the Chairman LRIP"), based on corporate performance, no awards will be paid under New LRIP for 2001.the cycle completed on December 31, 2002. There have been no other payouts under New LRIP or its predecessor plan since 1997. In order to help return the Company to profitability, the New LRIP program was suspended in 2002 with no cycle starting on January 1, 2002.
New LRIP is based on three-year performance cycles. Awards will be paid in cash. Award targets are 100%, 75% or 50% of salary. TargetsThe Committee determines targets for members of the Office of the Chairman and other executive officers are determined by the Committee. Targetsofficers. The CEO determines targets for other participants are determined by the CEO. A new three-year performance cycle began under New LRIP on January 1, 2001. However, theparticipants. The three-year cycle that otherwise would have started on January 1, 2002, has been suspended as a measure to reduce costs and return to profitability as quickly as possible. The cyclescycle currently in progress will continue through the cycle end datesdate in 2002 and 2003. A new cycle is expected to begin on January 1, 2003, assuming appropriate business conditions.
Under New LRIP, awards are based on one measure-relative total shareholder return ("TSR"). TSR is based on the following formula:
The Company's performance will then be compared to the performance of its peers. Awards will be paid based on TSR and how the Company has performed in comparison to its peers.
Newcurrent LRIP replaced the Long Range Inventive Plan of 1994 ("Old LRIP"). The Committee believes New LRIP better aligns senior management's interest with those of all shareholders. Old LRIP was based on four-year performance cycles. The last performance cycle under Old LRIP will endended in 2002. If a participant earns an award under Old LRIP in any remaining performance cycles and under New LRIP, only one award will be paid. No2002 with no awards were paid under Old LRIP for 2001.being earned.
3.Stock Option Plans: A wide range of managerial and individual contributors participate in the Company's stock option plans. There are approximately 43,000 current option holders.Approximately 44,600 employees were granted stock options in 2002. Stock options are typically awarded annually to encourage optionees to own Common Stock to align their personal financial worth to the Company's share price growth.
On January 3, 2001, the Committee made a special "Chairman's Challenge" grant of options to approximately 25,000 employees. The Chairman's Challenge Grant was designed to provide employees with an extra, shorter-term incentive to improve the Company's performance. The options vest and become exercisable on July 1, 2002. The exercise price for the options is $22.35/share, the fair market value of the Common Stock on the date of grant. For most employees, the options expire on May 3, 2003, although the expiration period is extended to December 3, 2003 for certain employees.
On March 16, 2001,7, 2002, the Committee granted options to approximately 38,00043,000 employees as part of the Company's traditional annual award of options. With a few minor exceptions, theseThese options vest and become exercisable in four equal annual installments with the first installment vesting on March 16, 2002.May 7, 2003. The exercise price for the options is $14.41/$14.44/share, the fair market value of the Common Stock on the date of grant. The options expire on March 16, 2011.May 7, 2012.
On one basis or another, the rewards under each of these major plans depend on overall Company performance, with some programs also taking into account sector, group, division, small team or individual performance. There have been years when the employees of entire sectors, groups, or divisions, as well as executive officers (including one or more of the five most highly compensated at that time) have received no payments under these plans.
The Compensation and Leadership Committee has established ownership guidelines for members of the Office of the Chairman and executive and senior vice presidents. The guidelines set a minimum level of ownership of: 4 times base salary for the Office of the Chairman; the lesser of 3 times base salary or 50,000 shares or units for executive vice presidents; and the lesser of 2 times base salary or 25,000 shares or units for senior vice presidents. Although the majority of the Company's peer companies do not require minimum ownership levels, the Company believes that these guidelines further align its rewards programs with shareholder interests.
Compensation for Members of the Office of the Chairman
The compensation for the members of the Office of the Chairman consists of base salary, PE=RMIP award eligibility, LRIP award eligibility, stock options, restricted stock or restricted stock units and
PROXY STATEMENT 25
certain other benefits. During 2001,2002, Christopher B. Galvin served as Chairman of the Board and Chief Executive Officer, and Robert L. Growney,Officer. On July 29, 2002, Mike Zafirovski replaced Edward Breen as President and Chief Operating Officer, were the members ofOfficer. Mr. Galvin and Mr. Zafirovski comprise the Office of the Chairman.
26 PROXY STATEMENT
The Committee studied the data gathered from the 22-company23-company peer group mentioned earlier to assess the appropriate competitive compensation levels for members of the Office of the Chairman.
Office of the Chairman Base Salary
In determining the base salaries of the Office of the Chairman, the Committee considered the results of the study together with the Company's performance on its own financial and non-financial strategic goals and the individual performance of the members of the Office of the Chairman. No particular weight was given to any one of these goals in setting base salaries for the members of the Office of the Chairman. The competitive study gave the Committee a base from which to modify salary and/orand incentive compensation based upon performance. At the end of 2001, Mr. Galvin's annual salary for all of 2002 was $1,275,000, and$1,275,000. Mr. Growney'sZafirovski's annual salary was $975,000. For 2002,$900,000 at the Committee recommended that theend of 2002. Mr. Galvin's base salaries of these members of the Office of the Chairman remain the same. The full Board approved the recommendation. Mr. Galvin and Mr. Growney's base salaries havesalary has not increased since 1999.
Office of the Chairman Annual PE=RMIP
For the 2001 PE=R2002 MIP awards, the Committee assessed performance based on the Officemeasures of PBT and free cash flow that comprise the formula for awards under the Plan. However, the Committee and Board also reviewed an assessment of the Chairman's Performance Excellence Scorecard which encompasses financial performance and progress on strategic initiatives. Due to the Company's unsatisfactory financial performance, no bonuses were paid to the membersresults of the Office of the Chairman along with a formal Board assessment of CEO performance in 2001.2002. The results of each were used to make recommendations on compensation for the Office of the Chairman. Based on these assessments, the Committee awarded $1,500,000 to Mr. Galvin and $750,000 to Mr. Zafirovski for 2002 performance. In particular, the Committee recognized that the Company exceeded the vast majority of the financial metrics that it set out to achieve in 2002, including metrics for PBT and free cash flow. In the middle phase of its turnaround, the Company returned to profitability in the second half of 2002 and generated $1.3 billion in cash from operating activities during 2002, including positive cash flow from operations in each quarter.
Office of the Chairman Stock Options
On March 16, 2001,May 7, 2002, as part of the Company's traditional annual award of stock options, Mr. Galvin was awarded options to purchase 900,0001,000,000 shares of Common Stock andStock. Mr. GrowneyZafirovski was awarded options to purchase 825,000600,000 shares of Common Stock.Stock on May 7, 2002 during which time he was serving as Executive Vice President and President, Personal Communications Sector. The exercise price for the options is $14.41$14.44 per share, the fair market value of the Common Stock on the date of grant. The options expire on March 16, 2011. Mr. Galvin'sMay 7, 2012. The options vest and become exercisable in equal annual installments over 4 years, with the first installment vesting on March 16, 2002.May 7, 2003. Mr. Growney'sZafirovski also received an additional award of 200,000 options vested on March 16, 2002.July 29, 2002 in connection with his promotion to President and Chief Operating Officer. The exercise price for these options is $10.90 per share, the fair market value of the Common Stock on the date of grant, The options vest in equal annual installments over 4 years, with the first installment vesting on July 29, 2003. The options expire on July 29, 2012.
The decision as to the number of options awarded was made using the Committee's judgment after considering the vesting scheduleperformance of the Company and expiration, reviewing data from the 22-company peer group mentioned earlier and assessing performance during 2000.earlier. Options were granted to these executives in order to provide them with strong incentive to increase the value of the Company.
Office of the Chairman LRIP
The minimum corporate four-year RONA percentage required to be met for paymentperformance requirements under both the Old and New LRIP wascycles that ended on December 31, 2002 were not met for the four-year periods ending with 1999, 2000 and 2001 andattained. As such, no payments were or will be made to any LRIP participant based on Company performance for these periods.either cycle. The first performancecompensation arrangements agreed to by the Company with Mr. Zafirovski when he joined the Company in 2000 provided for a guaranteed minimum payment of $650,000 under the Company's Long Range Incentive Plan for the three-year cycle for New LRIP will be completed onending December 31, 2002. At that time itAccordingly, Mr. Zafirovski will be determined if there will be any payments due for that performance cycle.receive this payment in 2003.
The cycle that otherwise would have started on January 1, 2002, has been suspended as a measure to reduce costs and return to profitability as quickly as possible. The cycles currently in progress will continue through the cycle end dates in 2002 and 2003. A new cycle is expected to begin on January 1, 2003, assuming appropriate business conditions. ThereOther than the guaranteed minimum payment to Mr. Zafirovski, there have been no payouts under New LRIP or its predecessor plan since 1997.
Transition in Office of the Chairman
On January 1, 2002, Edward Breen became the Company's President and Chief Operating Officer and joined the Office of the Chairman. Also on January 1, 2002, Robert Growney left the Office of the Chairman. Mr. Growney will serve as Vice Chairman of the Board until he retires from the Company on March 31, 2002.
Section 162(m) of the Internal Revenue Code
Section 162(m) of the Internal Revenue Code generally limits the corporate tax deduction to one million dollars for compensation paid to named executive officers unless certain requirements are met. The Company has not been entitled to deduct some amount of payments under MEIP in the past. MEIP awards fail to qualify as "performance based compensation" exempt from the limitation on deductions that is imposed by Section 162(m) because the Committee exercises discretion in making these awards. The awards under PE=R,MIP, the Stock Option Plan of 1996 Oldand LRIP and New LRIP(with the possible exception of any guaranteed award) meet the requirements for exemption under Section 162(m) and compensation paid under these plans in 2001,2002, if any, will be deductible. The Motorola Amended and Restated Incentive Plan of 1998 and the Motorola Omnibus Incentive Plan of 2000 and 2002 permit various types of awards, some of which qualify for exemption under Section 162(m) and some of which do not. Stock options, performance shares and stock appreciation rights that are granted under these plans qualify as "performance based compensation" and, as such, are exempt from the limitation on deductions. Outright grants of common stock, restricted stock, restricted stock units and/or cash do not qualify for exemption and are subject to the Section 162(m) limitation on deductions.
Overall, the Committee believes that the members of the Office of the Chairman are being appropriately compensated in a manner that relates to performance and is in the long-term interests of the stockholders.
Respectfully submitted,
Samuel C. Scott III, ChairmanH. Laurance FullerJohn E. Pepper, Jr.
| Respectfully submitted, | ||
Samuel C. Scott III, Chairman H. Laurance Fuller John E. Pepper, Jr. |
26 PROXY STATEMENT 27
REPORT OF AUDIT AND LEGAL COMMITTEE
During 2001,2002, the Audit and Legal Committee consisted of the following Directors: Anne P. Jones (Chair), H. Laurance Fuller, Judy C. Lewent and John A. White. On January 1, 2003, H. Laurance Fuller succeeded Anne P. Jones as Chair of the Committee. On February 4, 2003, B. Kenneth West replaced Judy C. Lewent as a member of the Committee. Each member of the Committee is independent as defined under the New York Stock Exchange listing standards. The Committee operates under a written charter that is adopted by the Board of Directors and reviewed by the Committee on an annual basis. The Committee's current charter, as adopted by the Board of Directors on February 4, 2003, is attached to this Proxy Statement as Appendix A.
The responsibilities of the Audit and Legal Committee are to assist the Board of Directors in fulfilling its oversight responsibilities as they relate to the Company's accounting policies, internal controls, financial reporting practices and legal and regulatory compliance. The Committee fulfills its responsibilities through periodic meetings with the Company's independent auditors, internal auditors and management. During fiscal 2001,2002, the Committee met 4 times, and the7 times. The Committee schedules its meetings with a view to ensuring that it devotes appropriate attention to all of its tasks. The Committee, or the Committee chairChair as representative of the Committee, discussed the interim financial information contained in each quarterly earnings announcement with the controller and the independent auditors, prior to public release. The Comittee also obtained a report, of the nature described in Statement on Auditing Standards (SAS) No. 71, from the independent auditors containing the results of their review of the interim financial statements.
Throughout the year the Audit and Legal Committee monitors matters related to the independence of KPMG LLP, the Company's independent auditors. As part of its monitoring activities, the Committee obtained a letter from KPMG, containing a description of all relationships between the auditors and the Company. After reviewing the letter and discussing it with management, the Committee discussed with the auditors its overall relationship with the Company and any of those relationships described in the letter that could impact KPMG's objectivity and independence. Based on its continued monitoring activities and year-end review, the Committee satisfied itself as to the auditors' independence. KPMG also has confirmed in its letter that, in its professional judgment, it is independent of the Company within the meaning of the Federal securities laws and within the requirements of Independence Standard Board (ISB) Standard No. 1,Independence Discussion with Audit Committees.
The Committee also discussed with management, the internal auditors and the independent auditors the quality and adequacy of the Company's internal controls and the internal audit function's management, organization, responsibilities, budget and staffing. The Committee reviewed with both the independent and the internal auditors their audit plans, audit scope, and identification of audit risks.
The Committee discussed and reviewed with the independent auditors all matters required by auditing standards generally accepted in the United States of America, including those described in SAS 61, "Communication with Audit Committees". With and without management present, the Committee discussed and reviewed the results of the independent auditors' examination of the financial statements. The Committee also discussed the results of the internal audit examinations.
The Committee reviewed the audited financial statements of the Company as of and for the fiscal year ended December 31, 2001,2002, with management and the independent auditors. Management has the responsibility for the preparation and integrity of the Company's financial statements and the independent auditors have the responsibility for the examination of those statements. Based on the above-mentioned review and discussions with management and the independent auditors, the Committee recommended to the Board that the Company's audited financial statements be included in its Annual Report on Form 10-K for the fiscal year ended December 31, 2001,2002, for filing with the Securities and Exchange Commission. The Committee also recommended the reappointment of the independent auditors and, based on such recommendation, the Board reappointed KPMG LLP as the Company's independent auditors. Pursuant to the Committee's revised Charter, beginning in 2003, the Committee will appoint the Company's independent auditors.
As specified in the Audit and Legal Committee Charter, it is not the duty of the Committee to plan or conduct audits or to determine that the Company's financial statements are complete and accurate and in accordance with accounting principles generally accepted in the United States of America. That is the responsibility of management and the Company's independent auditors. In giving its recommendation to the Board of Directors, the Committee has relied on (i) management's representation that such financial statements have been prepared with integrity and objectivity and in conformity with accounting principles generally accepted in the United States of America, and (ii) the report of the Company's independent auditors with respect to such financial statements.
Respectfully submitted,
Anne P. Jones, ChairH. Laurance FullerJudy C. LewentJohn A. White
| Respectfully submitted, | ||
H. Laurance Fuller, Chair Anne P. Jones Judy C. Lewent John A. White |
28 PROXY STATEMENT 27
The following graph compares the five-year cumulative total returns of Motorola, Inc., the S&P 500 Index, and a composite of the S&P Communications Equipment Index and the S&P Electronics (Semiconductors) Index. This composite peer group contains a total of 30 companies. The graph assumes $100 was invested in the stock or the Index on December 31, 1996,1997, and also assumes the reinvestment of dividends.
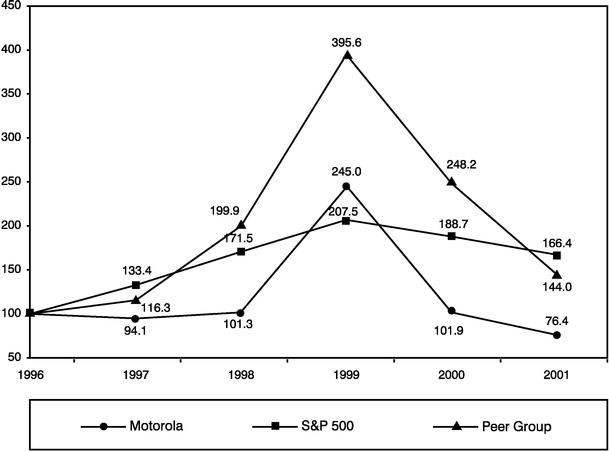
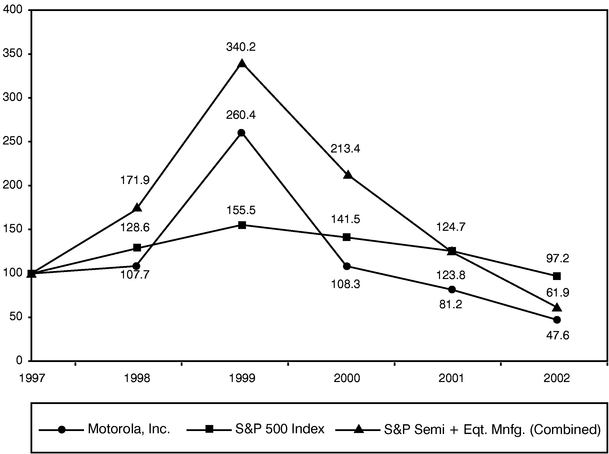
28 PROXY STATEMENT 29
The Board knows of no other business to be transacted at the 20022003 Annual Meeting of Stockholders, but if any other matters do come before the meeting, it is the intention of the persons named in the accompanying proxy to vote or act with respect to them in accordance with their best judgment.
Independent Public Accountants
KPMG LLP served as the Company's independent public accountants for the fiscal yearyears ended December 31, 2001 and December 31, 2002 and are serving in such capacity for the current fiscal year. The Board appoints independent public accountants annually. The decision of the Board is based on the recommendation of the Audit and Legal Committee, which reviews both the audit scope and estimated audit fees. Beginning in 2003, the Company's independent auditors will be appointed and engaged by the Audit and Legal Committee.
Representatives of KPMG LLP are expected to be present at the Annual Meeting and will have the opportunity to make a statement if they desire to do so and to respond to appropriate questions of stockholders.
The aggregate fees billed by KPMG LLP for professional services to the Company were $18.4 million in 2002 and $23.1 million in 2001.
Audit Fees
The aggregate fees billed by KPMG LLP for professional services rendered in connection with the audit of the Company's annual financial statements, for the year ended December 31, 2001, and the review of the Company's quarterly financial statements for the quarters ended March 30, 2001, June 30, 2001 and September 29, 2001,services that are normally provided in connection with statutory and regulatory filings or engagements were approximately $4.1 million.$6.9 million in 2002 and $7.0 million in 2001.
Financial Information Systems DesignAudit-Related Fees
The aggregate fees billed by KPMG LLP for professional assurance and Implementationrelated services reasonably related to the performance of the audit of the Company's financial statements, but not included under Audit Fees, were $1.6 million in 2002 and $2.6 million in 2001. These fees related to audits and due diligence in connection with acquisitions and dispositions by the Company.
Tax Fees
The aggregate fees billed by KPMG LLP for professional services renderedfor tax compliance, tax advice and tax planning were $9.1 million in connection with designing or implementing a hardware or software system during2002 and $10.4 million in 2001. These fees primarily related to consultation for the preparation of the Company's most recent fiscal yearU.S Federal, state and local tax returns and international subsidiaries tax returns and services provided to expatriated Company employees in preparing their tax returns. The Audit and Legal Committee has determined that KPMG LLP will not provide tax assistance for expatriate employees after the completion of 2001 tax returns. Accordingly, the Company does not expect to incur additional fees from KPMG LLP relating to these services (such fees were $5.1 million in 2002 and $4.3 million in 2001) in 2003 or beyond.
Other Fees
The aggregate fees for all other services rendered by KPMG LLP were $0.8 million in 2002 and $3.1 million in 2001. In 2002, these fees related primarily to forensic audits and litigation support. In 2001, $2.9 million. Thesemillion of these fees relaterelated to IT consulting services rendered before KPMG LLP's consulting business was spun-off into an independent entity in February 2001. Since that time, the Company has not utilized KPMG LLP to perform any consulting services. Theservices and, in 2002, the Audit and Legal Committee has implemented a policy whereby KPMG LLP may not provide IT consulting, internal audit outsourcing services or financial transaction structuring services in the future.
Other Fees
The aggregate fees for all other services rendered by KPMG LLP during the Company's most recent fiscal year were approximately $16.1 million, principally comprised of $10.4 million for tax services and $5.5 million for audit-related services. The Audit and Legal Committee has determined that KPMG LLP will not provide tax assistance for expatriate employees after the completion of 2001 tax returns.
The following table further summarizes fees billed to the Company by KPMG LLP during 2002 and 2001:
| | | Worldwide Fees ($ in millions) | |||||||||
|---|---|---|---|---|---|---|---|---|---|---|---|
| Service | Service | Worldwide Fees ($M's) | Service | 2002 | 2001 | ||||||
| Audit & Audit Related | |||||||||||
| Audit Fees | Audit Fees | ||||||||||
| Consolidated Audit | Consolidated Audit | $ | 4.1 | Consolidated Audit | $ | 5.7 | $ | 4.1 | |||
| Statutory Audits | Statutory Audits | $ | 0.8 | Statutory Audits | $ | 0.5 | $ | 0.8 | |||
| SEC Filings | SEC Filings | $ | 0.4 | SEC Filings | $ | 0.2 | $ | 0.4 | |||
| Acquisitions & Disposition Audits & Due Diligence | $ | 2.6 | |||||||||
| International Audit Related Services | International Audit Related Services | $ | 1.7 | International Audit Related Services | $ | 0.5 | $ | 1.7 | |||
| $ | 9.6 | $ | 6.9 | $ | 7.0 | ||||||
| Tax Service | |||||||||||
| Audit-Related Fees | Audit-Related Fees | ||||||||||
| Acquisition & Disposition Audits and Due Diligence | Acquisition & Disposition Audits and Due Diligence | $ | 1.6 | $ | 2.6 | ||||||
Tax Fees | Tax Fees | ||||||||||
| International Subsidiaries, Tax Return Preparation & Consultation | International Subsidiaries, Tax Return Preparation & Consultation | $ | 4.0 | International Subsidiaries, Tax Return Preparation & Consultation | $ | 3.0 | $ | 4.0 | |||
| Federal, State & Local Tax Services | Federal, State & Local Tax Services | $ | 2.1 | Federal, State & Local Tax Services | $ | 1.0 | $ | 2.1 | |||
| Expatriate Tax Services | Expatriate Tax Services | $ | 4.3 | Expatriate Tax Services | $ | 5.1 | $ | 4.3 | |||
| $ | 10.4 | $ | 9.1 | $ | 10.4 | ||||||
| Other Fees | Other Fees | ||||||||||
| IT Consulting Services (prior to spin-off in February 2001) | IT Consulting Services (prior to spin-off in February 2001) | $ | 2.9 | IT Consulting Services (prior to spin-off in February 2001) | — | $ | 2.9 | ||||
| Other Services | $ | 0.2 | |||||||||
| Forensic Audits & Litigation Support | Forensic Audits & Litigation Support | $ | 0.8 | $ | 0.2 | ||||||
| Total | $ | 23.1 | $ | 0.8 | $ | 3.1 | |||||
Total | $ | 18.4 | $ | 23.1 | |||||||
Audit and Legal Committee Pre-Approval Policies
In addition to retaining KPMG LLP to audit the Company's consolidated financial statements for 2002, KPMG LLP and many other accounting and consulting firms were
30 PROXY STATEMENT
retained to provide advisory, auditing and consulting services in 2002. The Audit and Legal Committee has restricted the non-audit services that KPMG LLP may provide to the Company, primarily to tax services and merger and acquisition-related due diligence and audit services. The Committee has further determined that the Company will obtain non-audit services from KPMG LLP only when the services offered by KPMG LLP are more effective or economical than services available from other service providers, and, to the extent possible, only after competitive bidding.
The Audit and Legal Committee has formal policies and procedures in place with regard to the approval of all professional services provided to the Company by KPMG LLP. With regard to "Audit and Audit-Related" services, the Committee reviews the annual audit plan and approves the estimated annual audit budget in advance. The Committee has provided the Company's Controller pre-approval to authorize any Audit and Audit-Related services during the period between Committee meetings. The Committee then reviews an updated estimate of the annual Audit and Audit- related fees in comparison to the overall budget at each regular Committee meeting.
With regard to "Tax" services, the Committee reviews the description and estimated annual budget for Tax services to be provided by KPMG LLP in advance. During 2002, the Committee provided the Company's Controller pre-approval to authorize any Tax services by KPMG LLP during the period between Committee meetings. The Committee then reviewed an updated estimate of the annual Tax fees and services at each regular Committee meeting. In 2003, the Committee has provided the Company Controller pre-approval to authorize Tax services by KPMG LLP only if those services have been previously reviewed and approved by the Committee. Proposed Tax services to be provided by KPMG LLP that have not been previously approved by the Committee can only be authorized between meetings by the Chair of the Committee, who, at his discretion, can request approval from the full Committee if he deems it appropriate.
With regard to "Other" services, the Committee reviews the description and estimated fees for any Other services to be provided by KPMG LLP in advance. Other than services involving de minimis fees, any proposed Other services to be provided by KPMG LLP that have not been previously approved by the Committee can only be authorized between meetings by the Chair of the Committee, who, at his discretion, can request approval from the full Committee if he deems it appropriate. The Committee reviews an updated estimate of the Other fees and services at each regular Committee meeting.
Manner and Cost of Proxy Solicitation
The Company pays the cost of soliciting proxies. In addition to mailing proxies, officers, directors and regular employees of the Company, acting on its behalf, may solicit proxies by telephone or personal interview. Also, the Company has retained D.F. King & Co. to aid in soliciting proxies. The Company will pay an estimated fee of $17,500, plus expenses, to D.F. King. The Company will, at its expense, request brokers and other custodians, nominees and fiduciaries to forward proxy soliciting material to the beneficial owners of shares held of record by such persons.
Section 16(a) Beneficial Ownership Reporting Compliance
Each director and certain officers of the Company are required to report to the Securities and Exchange Commission, by a specified date, his or her transactions related to Motorola Common Stock. Based solely on a review of the copies of reports furnished to the Company or written representations that no other reports were required, the Company believes that, during the 20012002 fiscal year, all filing requirements applicable to its officers, directors and greater than 10% beneficial owners were complied with, except that one report covering one transaction was filed late by each of Mr. Roberson, an executive officer, and Mr. Shlapak, an executive officer.with.
PROXY STATEMENT 29
List of Stockholders
A list of stockholders entitled to vote at the meeting will be available for examination at Motorola's Galvin Center, 1297 East Algonquin Road, Schaumburg, Illinois 60196 for ten days before the 20022003 Annual Meeting and at the Annual Meeting.
Proposals
Any stockholder who intends to present a proposal at the Company's 2003 annual meeting2004 Annual Meeting of stockholdersStockholders must send the proposal to: A. Peter Lawson, Secretary, Motorola, Inc., 1303 East Algonquin Road, Schaumburg, Illinois 60196.
If the stockholder intends to present the proposal at the Company's 2003 annual meeting2004 Annual Meeting of stockholdersStockholders and have it included in the Company's proxy materials for that meeting, the proposal:
The Company is not obligated to include any shareholder proposal in its proxy materials for the 2003 annual meeting2004 Annual Meeting if the proposal is received after the November 29, 200227, 2003 deadline.
If a stockholder submits a proposal after the November 29, 200227, 2003 deadline but still wishes to present the proposal at the 2003 annual meeting,2004 Annual Meeting, the proposal:
PROXY STATEMENT 31
A stockholder wishing to recommend a candidate for election to the Board should send the recommendation and a description of the person's qualifications to the Governance and Nominating Committee in care of the Secretary of Motorola at the address above. The Governance and Nominating Committee has full discretion in considering its nominations to the Board. A stockholder wishing to nominate a candidate for election to the Board is required to give written notice to the Secretary of the Company of his or her intention to make such a nomination. The notice of nomination must be received by the Company's Secretary at the address below no later than February 12, 2003.10, 2004. The notice of nomination is required to contain certain information about both the nominee and the stockholder making the nomination as set forth in the Company's bylaws. A nomination which does not comply with the above requirements will not be considered.
"Householding" of Proxy Materials
In December of 2000, the Securities and Exchange Commission adopted new rules that permit companies and intermediaries (e.g., brokers) to satisfy the delivery requirements for proxy statements with respect to two or more security holders sharing the same address by delivering a single proxy statement addressed to those security holders. This process, which is commonly referred to as "householding," potentially means extra convenience for security holders and cost savings for companies.
This year, a number of brokers with accountholders who are Motorola stockholders will be "householding" our proxy materials. As indicated in the notice previously provided by these brokers to Motorola stockholders, a single proxy statement will be delivered to multiple stockholders sharing an address unless contrary instructions have been received from an affected stockholder. Once you have received notice from your broker or the Company that they will be "householding" communications to your address, "householding" will continue until you are notified otherwise or until you revoke your consent. If, at any time, you no longer wish to participate in "householding" and would prefer to receive a separate proxy statement, please notify your broker, direct your written request to Motorola, Inc., Investor Relations, 1303 E. Algonquin Road, Schaumburg, IL 60196 or contact Investor Relations at (800) 262-8509.broker.
Stockholders who currently receive multiple copies of the proxy statement at their address and would like to request "householding" of their communications should contact their broker or, if a stockholder is a direct holder of Motorola shares, they should submit a written request to Mellon Investor Services, the Company's transfer agent, at Mellon Investor Services LLC, Shareholder relations Department, P.O. Box 3315, South Hackensack, New Jersey 07606-1915.broker.
Form 10-K
The Company will mail, without charge, a copy of the Annual Report on Form 10-K, if requested to do so by stockholders. Direct requests to Investor Relations, 1303 E. Algonquin Road, Schaumburg, IL 60196. The report also is available on the Company's websitewww.motorola.com/investor.
By order of the Board of Directors,
| By order of the Board of Directors, | ||
A. Peter Lawson Secretary |
![]()
A. Peter LawsonSecretary
3032 PROXY STATEMENT
MANAGEMENT'S DISCUSSION AND ANALYSIS
OF FINANCIAL CONDITION AND RESULTS OF OPERATIONS
This commentary should be read in conjunction with the Company's consolidated financial statements and related notes, presented on pages F-42 through F-77,F-76, of this Proxy Statement for a full understanding of Motorola's financial position and results of operations.
In accordance with Rule 14a-3(c) under the Securities Exchange Act of 1934 (the "Exchange Act"), as adapted to the "Summary Annual Report" procedure, the information contained in the following commentary and consolidated financial statements and notes is provided solely for the information of stockholders and the Securities and Exchange Commission. Such information shall not be deemed to be "soliciting material" or to be "filed" with the Commission or subject to Regulation 14A under the Exchange Act (except as provided in Rule 14a-3) or to the liabilities of Section 18 of the Exchange Act, unless, and only to the extent that, it is expressly incorporated by reference into the Form 10-K of Motorola, Inc. for its fiscal year endingended December 31, 2001.2002.
Results of Operations
| | For the Years Ended December 31, | |||||||||||||||
|---|---|---|---|---|---|---|---|---|---|---|---|---|---|---|---|---|
| (Dollars in millions, except per share amounts) | 2002 | % of Sales | 2001 | % of Sales | 2000 | % of Sales | ||||||||||
| Net sales | $ | 26,679 | $ | 29,873 | $ | 37,346 | ||||||||||
| Costs of sales | 17,938 | 67.2% | 22,661 | 75.9% | 25,168 | 67.4% | ||||||||||
| Gross margin | 8,741 | 32.8% | 7,212 | 24.1% | 12,178 | 32.6% | ||||||||||
| Selling, general and administrative expenses | 4,203 | 15.8% | 4,723 | 15.8% | 5,733 | 15.4% | ||||||||||
| Research and development expenditures | 3,754 | 14.1% | 4,318 | 14.5% | 4,437 | 11.9% | ||||||||||
| Reorganization of businesses | 1,764 | 6.6% | 1,858 | 6.2% | 596 | 1.6% | ||||||||||
| Other charges | 833 | 3.1% | 2,116 | 7.1% | 517 | 1.4% | ||||||||||
| Operating earnings (loss) | (1,813 | ) | (6.8)% | (5,803 | ) | (19.4)% | 895 | 2.4% | ||||||||
| Other income (expense): | ||||||||||||||||
| Interest expense, net | (356 | ) | (1.3)% | (413 | ) | (1.4)% | (171 | ) | (0.5)% | |||||||
| Gains on sales of investments and businesses, net | 96 | 0.4% | 1,931 | 6.5% | 1,570 | 4.2% | ||||||||||
| Other | (1,373 | ) | (5.1)% | (1,226 | ) | (4.1)% | (63 | ) | (0.2)% | |||||||
| Total other income (expense) | (1,633 | ) | (6.1)% | 292 | 1.0% | 1,336 | 3.6% | |||||||||
| Earnings (loss) before income taxes | (3,446 | ) | (12.9)% | (5,511 | ) | (18.4)% | 2,231 | 6.0% | ||||||||
| Income tax expense (benefit) | (961 | ) | (3.6)% | (1,574 | ) | (5.3)% | 913 | 2.4% | ||||||||
| Net earnings (loss) | $ | (2,485 | ) | (9.3)% | $ | (3,937 | ) | (13.2)% | $ | 1,318 | 3.5% | |||||
| Diluted earnings (loss) per common share | $ | (1.09 | ) | $ | (1.78 | ) | $ | 0.58 | ||||||||
MANAGEMENT'S DISCUSSION AND ANALYSIS OF FINANCIAL CONDITION AND RESULTS OF OPERATIONS F-1
Geographic market sales, measured by the locale of the end customer, as a percent of total net sales, for 2002, 2001 and 2000 are as follows:
Geographic Market Sales by Locale of End Customer
| | 2002 | 2001 | 2000 | |||
|---|---|---|---|---|---|---|
| United States | 45% | 44% | 42% | |||
| Europe | 14% | 14% | 16% | |||
| China | 14% | 13% | 12% | |||
| Asia, excluding China and Japan | 11% | 8% | 8% | |||
| Latin America | 7% | 9% | 8% | |||
| Japan | 3% | 5% | 6% | |||
| Other Markets | 6% | 7% | 8% | |||
| 100% | 100% | 100% | ||||
Results of Operations—2002 Compared to 20002001
GAAP ResultsNet Sales
| | Years Ended | ||||||||||
|---|---|---|---|---|---|---|---|---|---|---|---|
| (in millions, except per share amounts) | December 31, 2001 | % of Sales | December 31, 2000 | % of Sales | |||||||
| Net sales | $ | 30,004 | $ | 37,580 | |||||||
| Percent change from prior year | -20% | 14% | |||||||||
| Costs and expenses | |||||||||||
| Manufacturing and other costs of sales | 21,445 | 71.5% | 23,628 | 62.9% | |||||||
| Selling, general and administrative expenses | 3,703 | 12.3% | 5,141 | 13.7% | |||||||
| Research and development expenditures | 4,318 | 14.4% | 4,437 | 11.8% | |||||||
| Depreciation expense | 2,357 | 7.9% | 2,352 | 6.3% | |||||||
| Reorganization of businesses | 1,858 | 6.2% | 596 | 1.6% | |||||||
| Other charges | 3,328 | 11.1% | 517 | 1.4% | |||||||
| Interest expense, net | 437 | 1.5% | 248 | 0.7% | |||||||
| Gains on sales of investments and businesses | (1,931 | ) | -6.4% | (1,570 | ) | -4.2% | |||||
| Total costs and expenses | 35,515 | 35,349 | |||||||||
| Earnings (loss) before income taxes | (5,511 | ) | -18.4% | 2,231 | 5.9% | ||||||
| Income tax provision | (1,574 | ) | 913 | ||||||||
| Net earnings (loss) | $ | (3,937 | ) | -13.1% | $ | 1,318 | 3.5% | ||||
| Diluted earnings (loss) per common share | $ | (1.78 | ) | $ | 0.58 | ||||||
Net sales were $26.7 billion in 2002, down 11% from $29.9 billion in 2001. The results of operations shown above are presentedoverall decline in accordance with accounting principles generally acceptednet sales was primarily related to reduced customer capital spending in the United States of America (GAAP).industries served by: (i) the Global Telecom Solutions segment, where segment net sales decreased by $1.9 billion, (ii) the Broadband Communications segment, where segment net sales decreased by $767 million, and (iii) the Commercial, Government and Industrial Solutions segment, where segment net sales decreased by $577 million. All segments reported lower sales in 2002 than 2001, except for the Personal Communications segment.
The Company has sold several businesses since the beginning of 2000. DuringIn 2001, the Company sold its Integrated Information Systems Group, (IISG)the Company's defense and government electronics business, and the Multiservice Networks Division, a provider of end-to-end managed network solutions. These businesses were included in the Commercial, Government and Industrial Solutions and the Other Products segments, respectively. Businesses sold accounted for $553 million of net sales in 2001.
For the full year 2003, the Company expects net sales to be approximately $27.5 billion, representing a 3% increase from sales of $26.7 billion in 2002. Sales growth is expected in four of the Company's six major segments, excluding the Global Telecom Solutions and Broadband Communications segments, whose industries are again expected to decline as customers continue to reduce capital spending.
Gross margin
Gross margin increased to $8.7 billion, or 32.8% of net sales, in 2002, compared to $7.2 billion, or 24.1% of net sales, in 2001. The majority of the improvement was due to: (i) a decrease in reorganization of businesses charges, (ii) reductions in fixed manufacturing costs, and (iii) lower material costs resulting from improved supply-chain efficiencies.
The 2002 gross margin included reorganization of businesses charges of $56 million, which were included in Costs of Sales and primarily related to direct labor employee severance costs. The 2001 gross margin included reorganization of businesses charges of $1.0 billion, which were included in Costs of Sales and primarily related to $520 million for product portfolio simplification write-offs and $443 million for direct labor employee severance costs. Additionally, businesses sold accounted for $167 million in gross margin in 2001.
The Company expects gross margin, both in dollars and as a percentage of sales, to increase for the full year 2003 compared to 2002. The anticipated increase reflects: (i) expected full year savings in 2003 from the manufacturing cost-reduction initiatives implemented in 2002, (ii) additional cost savings from supply-chain initiatives to be implemented in 2003, and (iii) an expected increase in net sales.
Selling, general and administrative expenses
Selling, general and administrative (SG&A) expenses were $4.2 billion, or 15.8% of net sales, in 2002, compared to $4.7 billion, or 15.8% of net sales, in 2001. The decrease in SG&A expenses was primarily related to: (i) benefits from the Company's cost-reduction activities, and (ii) a $96 million decrease in intangible and goodwill amortization, partially offset by a $13 million decrease in royalty income.
The Company records royalty income as an offset to SG&A expenses. Royalty income was $600 million in 2002, compared to $613 million in 2001. Additionally, businesses sold accounted for $107 million in SG&A expenditures in 2001.
The Company expects SG&A expenses, both in dollars and as a percentage of sales, to be lower in 2003 than in 2002 due to: (i) full year savings in 2003 from cost-reduction initiatives implemented in 2002, (ii) additional cost savings from initiatives to be implemented in 2003, and (iii) the expected increase in net sales, partially offset by an increase in selling expenses as the Company continues to increase its focus on marketing and advertising.
Research and development expenditures
Research and development (R&D) expenditures declined 13% to $3.8 billion, or 14.1% of net sales, in 2002, compared to $4.3 billion, or 14.5% of net sales, in 2001. Spending on low-priority programs was reduced or ended as the Company continued to execute on its cost-reduction initiatives. Businesses sold accounted for $31 million of R&D expenditures in 2001.
R&D dollar spending is expected to be lower in 2003 than in 2002, as spending on lower priority programs will
F-2 MANAGEMENT'S DISCUSSION AND ANALYSIS OF FINANCIAL CONDITION AND RESULTS OF OPERATIONS
continue to be reduced or eliminated as the Company continues to execute on its cost-reduction initiatives. The Company also expects R&D expenditures to be lower as a percentage of sales in 2003 than in 2002 due to the expected increase in sales.
Reorganization of businesses
Total reorganization of businesses charges in 2002 were $1.82 billion, including $1.76 billion reflected in the consolidated statements of operations under Reorganization of Businesses and $56 million included in Costs of Sales. Total reorganization of businesses charges in 2001 were $2.9 billion, including $1.9 billion reflected under Reorganization of Businesses and $1.0 billion included in Costs of Sales. Reorganization of businesses charges include costs associated with workforce reductions, product line discontinuations, business exits, and consolidation of manufacturing and administrative operations. These charges are discussed in further detail in the "Reorganization of Businesses Programs" section below.
The Company expects a significant decline in reorganization of businesses charges in 2003, as compared to 2002.
Other charges
Charges classified as Other Charges were $833 million in 2002, compared to $2.1 billion in 2001. Other charges in 2002 were primarily comprised of: (i) $526 million for potentially uncollectible finance receivables to fully reserve a loan to Telsim, a wireless service provider in Turkey, who is currently in default on its $2.0 billion loan from the Company, (ii) $325 million for an intangible asset impairment charge relating to a license to certain intellectual property that enables the Company to provide national authorization services for digital set-top terminals, (iii) $80 million for potential repayments of incentives related to impaired facilities, and (iv) $12 million for acquired in-process research and development charges primarily related to the acquisition of Synchronous, Inc., partially offset by: (i) $63 million of income from the reduction of accruals, primarily related to termination settlements relating to Iridium, a discontinued program to launch a low orbit satellite communications system, and (ii) $24 million of income from the reduction of accruals no longer needed due to the settlement of certain environmental claims.
Other charges in 2001 were primarily comprised of: (i) $1.5 billion for potentially uncollectible finance receivables, of which $1.4 billion related to the $2.0 billion loan to Telsim, (ii) $398 million related to litigation and arbitration settlements, of which $365 million related to the Company's guarantee of a credit agreement for Iridium LLC, (iii) $116 million for goodwill and intangible asset impairments, primarily related to the Internet Software and Content Group, a business included in the Other Products segment, (iv) $45 million for contract termination charges, and (v) $40 million for in-process research and development charges relating to the acquisitions of Blue Wave Systems, Inc., included in the Integrated Electronic Systems segment, and RiverDelta Networks, Inc., included in the Broadband Communications segment.
The Company expects a significant decline in other charges in 2003, as compared to 2002.
Net interest expense
Net interest expense was $356 million in 2002, compared to $413 million in 2001. Net interest expense in 2002 included interest expense of $668 million, partially offset by interest income of $312 million. Net interest expense in 2001 included interest expense of $786 million, partially offset by interest income of $373 million. The decrease in net interest expense in 2002 compared to 2001 reflects: (i) a reduction in overall debt levels, (ii) benefits derived from interest rate swaps due to lower interest rates, and (iii) lower rates for commercial paper and other short-term borrowings due to the low general interest rate environment, partially offset by: (i) higher interest rates on long-term debt issued in the fourth quarter of 2001, (ii) lower interest income on cash balances due to the low general interest rate environment, and (iii) a reduction in interest income earned on impaired long-term customer finance receivables.
The Company expects net interest expense to be lower in 2003 than in 2002 due to a decrease in interest expense as a result of a reduction in overall debt levels during 2003, including the $825 million reduction in short-term debt resulting from the Company's redemption of its Puttable Reset Securities (PURS) in February 2003.
Gains on sales of investments and businesses
Gains on sales of investments and businesses were $96 million in 2002, compared to $1.9 billion in 2001. The 2002 net gains primarily related to: (i) the sale of equity securities of other companies held for investment purposes, (ii) the sale of the CodeLink™ bioarray business, and (iii) the reduction of accruals after the settlement of contingencies associated with the prior sales of certain businesses. The 2001 net gains primarily resulted from: (i) the sale of investments in several cellular operating companies outside the U.S., (ii) the sale of the Integrated Information Systems Group, and (iii) the sale of equity securities of other companies held for investment purposes.
Other
Charges classified as Other, as presented in Other Income (Expense), were $1.4 billion in 2002, compared to $1.2 billion in 2001. Charges classified as Other in 2002 primarily related to: (i) investment impairment charges related to the Company's investments in Nextel Communications, Inc.; an Argentine cellular operating company; Telus Corporation; and Callahan Associates International L.L.C., and (ii) debt redemption charges paid in 2002 that related
MANAGEMENT'S DISCUSSION AND ANALYSIS OF FINANCIAL CONDITION AND RESULTS OF OPERATIONS F-3
to the $825 million of Puttable Reset Securities (PURS) that were redeemed in February 2003.
Charges classified as Other in 2001 primarily related to investment impairment charges related to the Company's investments in United Pan-Europe Communications n.v., Open TV Corporation, Telus Corporation and Teledesic Corporation.
The Company expects a significant decline in charges included in Other within Other Income (Expense) in 2003, as compared to 2002.
Effective tax rate
The effective tax rate was 28% in 2002, representing a $961 million net tax benefit. The effective tax rate was 29% in 2001, representing a $1.6 billion net tax benefit. The 2002 effective tax rate is less than the U.S. statutory tax rate of 35% due primarily to: (i) the mix of earnings and losses by region and foreign tax rate differentials, and (ii) losses incurred in countries where, due to loss positions, the Company was unable to realize associated tax benefits.
The Company expects the effective tax rate for the full year 2003 to be between 34% and 36%. The increase in the effective tax rate in 2003, as compared to 2002, is due primarily to the expected increase in the Company's earnings and the mix of earnings and losses by region.
Loss
The Company incurred a loss before income taxes of $3.4 billion in 2002, compared to a loss before income taxes of $5.5 billion in 2001. After taxes, the Company incurred a net loss of $2.5 billion, or ($1.09) per share, in 2002, compared to a net loss of $3.9 billion, or ($1.78) per share, in 2001.
The $2.1 billion decline in the loss before income taxes in 2002 was primarily attributed to: (i) a $1.5 billion improvement in gross margin, despite a $3.2 billion decrease in net sales, including a $1.0 billion decrease in reorganization of businesses charges included in Costs of Sales, (ii) a $1.3 billion decrease in other charges, (iii) a $564 million decline in R&D expenditures, and (iv) a $520 million decline in SG&A expenditures. The decrease was partially offset by lower gains on sales from investments and businesses of $1.8 billion. Also, businesses sold in 2001 accounted for $23 million of earnings before income taxes in 2001.
Earnings Outlook for 2003
Based on current market conditions and the general economic outlook, and barring any unforeseen political or economic disruptions, the Company expects to be profitable and report earnings per share of approximately $0.40 for the full year 2003, compared to a loss per share of ($1.09) for the full year 2002. This expected improvement is attributed primarily to: (i) an expected increase in sales, (ii) an expected decrease in manufacturing expenses, both in dollars and as a percent of sales, as a result of full-year savings from cost-reduction initiatives implemented in 2002, (iii) an expected decrease in reorganization of businesses charges, (iv) an expected decrease in other charges, and (v) an expected additional cost savings from initiatives to be implemented in 2003.
Results of Operations—2001 Compared to 2000
Net Sales
Net sales were $29.9 billion in 2001, down 20% from $37.3 billion in 2000. The decline in net sales was attributed primarily to lower average selling prices and unit sales in the Personal Communications and Global Telecom Solutions segments, and lower unit sales in the Semiconductor Products segment.
In 2001, the Company sold its Integrated Information Systems Group, the Company's defense and government electronics business, and the Multiservice Networks Division, a provider of end-to-end managed network solutions. In the first quarter of 2000, the Company sold its electronic ballast business.
The Company's results of operations include special items. Special items include employee severance costs, fixed asset impairments, litigation-related charges, investment impairments, goodwill/intangible asset impairments, in-process research and development charges, goodwill amortization, other unusual charges and gains on sales of investments and businesses. These special items resulted in a net charge of $4.5 billion before income taxes, or $3.3 billion after income taxes, in 2001 and a net charge of $651 million before income taxes, or $733 million after income taxes, in 2000.
MANAGEMENT'S DISCUSSION AND ANALYSIS OF FINANCIAL CONDITION AND RESULTS OF OPERATIONS F-1
Results of Operations for Ongoing Businesses, Excluding Special Items
The results of operations shown below exclude the results ofsold businesses sold and special items from the GAAP results of operations for the years ended December 31, 2001 and December 31, 2000.
| | For the Year Ended December 31, 2001 | ||||||||||||||||
|---|---|---|---|---|---|---|---|---|---|---|---|---|---|---|---|---|---|
| (in millions, except per share amounts) | GAAP Results | % of Sales | Special Items Inc/(Exp) | Exited Businesses Inc/(Exp) | Ongoing Operations Excluding Special Items | % of Sales | |||||||||||
| Net sales | $ | 30,004 | $ | — | $ | 553 | $ | 29,451 | |||||||||
| Costs and expenses | |||||||||||||||||
| Manufacturing and other costs of sales | 21,445 | 71.5% | (1,081 | ) | (383 | ) | 19,981 | 67.8% | |||||||||
| Selling, general and administrative expenses | 3,703 | 12.3% | (125 | ) | (99 | ) | 3,479 | 11.8% | |||||||||
| Research and development expenditures | 4,318 | 14.4% | — | (31 | ) | 4,287 | 14.6% | ||||||||||
| Depreciation expense | 2,357 | 7.9% | — | (17 | ) | 2,340 | 7.9% | ||||||||||
| Reorganization of businesses | 1,858 | 6.2% | (1,858 | ) | — | — | — | ||||||||||
| Other charges | 3,328 | 11.1% | (3,328 | ) | — | — | — | ||||||||||
| Interest expense, net | 437 | 1.5% | (22 | ) | — | 415 | 1.4% | ||||||||||
| Gains on sales of investments and businesses | (1,931 | ) | -6.4% | 1,931 | — | — | — | ||||||||||
| Total costs and expenses | 35,515 | (4,483 | ) | (530 | ) | 30,502 | |||||||||||
| Earnings (loss) before income taxes | (5,511 | ) | -18.4% | (4,483 | ) | 23 | (1,051 | ) | -3.6% | ||||||||
| Income tax provision | (1,574 | ) | 1,227 | (7 | ) | (354 | ) | ||||||||||
| Net earnings (loss) | $ | (3,937 | ) | -13.1% | $ | (3,256 | ) | $ | 16 | $ | (697 | ) | -2.4% | ||||
| Diluted loss per common share | $ | (1.78 | ) | $ | (0.31 | ) | |||||||||||
| | For the Year Ended December 31, 2000 | ||||||||||||||||
|---|---|---|---|---|---|---|---|---|---|---|---|---|---|---|---|---|---|
| (in millions, except per share amounts) | GAAP Results | % of Sales | Special Items Inc/(Exp) | Exited Businesses Inc/(Exp) | Ongoing Operations Excluding Special Items | % of Sales | |||||||||||
| Net sales | $ | 37,580 | $ | — | $ | 825 | $ | 36,755 | |||||||||
| Costs and expenses | |||||||||||||||||
| Manufacturing and other costs of sales | 23,628 | 62.9% | (887 | ) | (555 | ) | 22,186 | 60.4% | |||||||||
| Selling, general and administrative expenses | 5,141 | 13.7% | (221 | ) | (180 | ) | 4,740 | 12.9% | |||||||||
| Research and development expenditures | 4,437 | 11.8% | — | (57 | ) | 4,380 | 11.9% | ||||||||||
| Depreciation expense | 2,352 | 6.3% | — | (25 | ) | 2,327 | 6.3% | ||||||||||
| Reorganization of businesses | 596 | 1.6% | (596 | ) | — | — | — | ||||||||||
| Other charges | 517 | 1.4% | (517 | ) | — | — | — | ||||||||||
| Interest expense, net | 248 | 0.7% | — | — | 248 | 0.7% | |||||||||||
| Gains on sales of investments and businesses | (1,570 | ) | -4.2% | 1,570 | — | — | — | ||||||||||
| Total costs and expenses | 35,349 | (651 | ) | (817 | ) | 33,881 | |||||||||||
| Earnings (loss) before income taxes | 2,231 | 5.9% | (651 | ) | 8 | 2,874 | 7.8% | ||||||||||
| Income tax provision | 913 | (82 | ) | (2 | ) | 829 | |||||||||||
| Net earnings (loss) | $ | 1,318 | 3.5% | $ | (733 | ) | $ | 6 | $ | 2,045 | 5.6% | ||||||
| Diluted earnings per common share | $ | 0.58 | $ | 0.91 | |||||||||||||
Sales
Sales were $30.0 billion in 2001, down 20% from $37.6 billion a year earlier. The decline in sales was attributed primarily to lower average selling prices and units sales in the Personal Communications and Global Telecom Solutions segments and lower unit sales in the Semiconductor Products segment.
Businesses that have been sold since the beginning of 2000 accounted for $553 million of sales in 2001 and $825 million of sales in 2000. In 2002,
Gross margin
Gross margin decreased to $7.2 billion, or 24.1% of net sales, in 2001, compared to $12.2 billion, or 32.6% of net sales, in 2000. The net decrease was primarily due to: (i) the Company expects$7.5 billion decrease in sales, from ongoing operations,(ii) a reduction in sales volumes more quickly than the reduction of fixed manufacturing costs, which excluderesulted in less absorption of fixed costs, and (iii) direct labor employee severance costs across all segments associated with the impactCompany's cost-reduction activities. Although significant reorganization of businesses programs were implemented in 2001, a full year benefit of these cost-reduction activities was not realized until 2002.
The 2001 gross margin included reorganization of businesses charges of $1.0 billion, which were included in Costs of Sales and were primarily comprised of $520 million for product portfolio simplification write-offs and $443 million for direct labor employee severance costs. The 2000 gross margin included reorganization of businesses charges of $887 million, which were included in Costs of Sales and were primarily comprised of product portfolio simplification write-offs, mainly in the Personal Communications segment. Additionally, businesses sold to decline between 5%accounted for $167 million and 10%$261 million in gross margin in 2001 and 2000, respectively.
Selling, general and administrative expenses
Selling, general and administrative (SG&A) expenses were $4.7 billion, or 15.8% of net sales, in 2001, compared to 2001 largely due to lower anticipated$5.7 billion, or 15.4% of net sales, in the Global Telecom Solutions, Broadband Communications and Integrated Electronic Systems segments.2000. The decrease in SG&A expenses was primarily attributable to benefits
F-2F-4 MANAGEMENT'S DISCUSSION AND ANALYSIS OF FINANCIAL CONDITION AND RESULTS OF OPERATIONS
Geographic market sales, measured by the locale of the end customer, as a percent of total sales, for 2001 and 2000 are as follows:
Geographic Market Sales by Locale of End Customer
| | 2001 | 2000 | ||
|---|---|---|---|---|
| United States | 44% | 42% | ||
| Europe | 14% | 16% | ||
| China | 13% | 12% | ||
| Latin America | 9% | 8% | ||
| Asia, excluding China and Japan | 8% | 8% | ||
| Japan | 5% | 6% | ||
| Other Markets | 7% | 8% | ||
| 100% | 100% | |||
Earnings before income taxes
The Company incurred a loss before income taxes of $5.5 billion in 2001, compared with earnings before income taxes of $2.2 billion in 2000. Net losses were $3.9 billion, or ($1.78) per share, in 2001 compared with net earnings of $1.3 billion, or 58 cents per share, in 2000. The $7.7 billion decline in earnings before income taxes was primarily attributed to: (i) an increase of $4.2 billion in special charges for restructuring, asset impairments and provision for potentially uncollectible long-term finance receivables, and (ii) a decrease in profit of $5.2 billion resulting from decreased sales volume and an increase in manufacturing costs as a percent of sales, partially offset by: (i) a decline in selling, general and administrative expenses of $1.3 billion, and (ii) an increase of $361 million in gains on sales of investments and businesses. The Semiconductor Products, Global Telecom Solutions, Broadband Communications and Personal Communications segments were the principal contributors to the decrease in earnings. For the year, all segments other than the Commercial, Government and Industrial Solutions and Other Products segments had an operating loss. Excluding the impact of exited businesses and special charges from both years, the Company incurred a loss before income taxes of $1.1 billion in 2001, compared to earnings before income taxes of $2.9 billion in 2000.
Based on the current market and economic outlook and barring any unforeseen political or economic disruptions, the Company plans to be profitable in 2002 on a full-year basis, excluding the impact of special items. The Company believes it can attain profitability despite anticipated lower sales due to: (i) improved efficiencies; (ii) a reduced cost structure as a result of the reorganization of businesses programs initiated in the latter half of 2000 and throughout 2001; (iii) improved manufacturing margin and increased sales of wireless handsets in the Personal Communications segment, and (iv) expected recovery in the worldwide semiconductor industry and improved manufacturing margin in the Semiconductor Products segment. The Company expects to record special items in 2002. However, due to the uncertain nature of special items it is not possible for the Company to estimate the full-year impact of these items on 2002 results, however, the Company does not expect to be profitable in 2002 inclusive of these charges.
Manufacturing and other costs of sales
Manufacturing and other costs of sales were $21.4 billion, or 71.5% of sales in 2001, compared to $23.6 billion, or 62.9% of sales, in 2000. Manufacturing and other costs of sales in 2001 include $1.1 billion of special charges, primarily related to product portfolio simplification write-offs in the Personal Communications segment and severance costs across all segments associated with the Company's cost-reduction activities. Manufacturing and other costs of sales in 2000 include $887 million of special charges, consisting primarily of product portfolio simplification write-offs in the Personal Communications segment.
Excluding the impact of exited businesses and special charges, manufacturing and other costs of sales were 67.8% of sales in 2001 compared to 60.4% of sales in 2000. The segments primarily contributing to this increase were the Semiconductor Products, Global Telecom Solutions and Personal Communications segments. The segments contributing to the increase all experienced a decline in sales year over year while manufacturing and other costs of sales did not decrease proportionately. Although significant reorganization of businesses programs were implemented throughout 2001, the full benefit of the Company's cost-reduction activities is not reflected in 2001 manufacturing and other cost of sales because the cost-reduction activities were initiated throughout the year with certain of these actions expected to be completed during 2002.
Excluding the impact of exited businesses and special items, the Company expects manufacturing and other costs of sales to decrease as a percent of sales for the full-year 2002 compared to 2001. The anticipated decrease reflects expected savings across all segments as a result of the cost-reduction activities initiated during 2001, as well as an expected mix shift to higher-margin products in the Personal Communications segment.
Selling, general and administrative expenses
Selling, general and administrative expenses were $3.7 billion, or 12.3% of sales, in 2001 compared to $5.1 billion, or 13.7% of sales, in 2000. Selling, general and administrative expenses include $125 million and $221 million of special charges in 2001 and 2000, respectively. These special charges were primarily comprised of amortization of goodwill, which was $165 million and $170 million in 2001 and 2000, respectively. The decrease in selling, general and administrative expenses in 2001 compared to 2000 is primarily attributable to benefits realized from the Company's cost-reduction activities in 2000 and 2001.
MANAGEMENT'S DISCUSSION AND ANALYSIS OF FINANCIAL CONDITION AND RESULTS OF OPERATIONS F-3
Excluding the impact of exited businesses and special items, the Company expects selling, general and administrative expenses to remain at 12% of sales in 2002. The Company expectsrecords royalty income as an offset to realize savingsSG&A expenses. Royalty income was $613 million in general2001 and administrative$790 million in 2000. Businesses sold in 2001 and 2000 accounted for $107 million and $193 million of SG&A expenses, from the cost-reduction activities initiated throughout 2000 and 2001, but these reductions are expected to be offset by an increase in selling expenditures as the Company continues its focus on marketing and advertising.respectively.
Research and development expenditures
Research and development (R&D) expenditures declined 3% to $4.3 billion in 2001, compared to $4.4 billion in 2000. Research and development expenditures were lower inSpending on low-priority programs was reduced or ended as the Personal Communications, Semiconductor Products and Global Telecom Solutions segments. These reductions were partially offset byCompany began to execute on its cost-reduction initiatives, although the Company increased spending inon corporate development projects. Despite an expected decline in sales in 2002, the Company continues to believe that a strong commitment to researchBusinesses sold accounted for $31 million and development is required to drive long-term growth as part of its core business strategy and expects to invest in research and development at approximately the same level in 2002 as in 2001.
Depreciation expense
Depreciation expense was $2.4 billion in both 2001 and 2000. An increase of $86$57 million of depreciation expense in the Semiconductor Products segment (SPS) was offset by a decrease in depreciation expense in other segments, primarily due to asset disposals. The level of depreciation expense is impacted by: (i) capitalR&D expenditures (ii) the time required to prepare assets for their intended use and (iii) asset impairments. Capital expenditures in 2001 were $1.3 billion, compared to $4.1 billion in 2000. The majority of the decrease in capital expenditures occurred in SPS, where capital expenditures decreased to $613 million in 2001 from $2.4 billion in 2000 to address overcapacity as a result of the downturn in the semiconductor industry. In SPS, an extended period of time is often required to prepare assets for their intended use. The majority of the SPS capital expenditures in 2000 did not commence depreciation until the latter half of 2001 due to required modifications and the realignment of manufacturing facilities in SPS. Accordingly, the full impact on depreciation expense for the 2000 SPS capital expenditures was not reflected in the $86 million increase in depreciation expense for SPS discussed above.
In connection with reorganization of businesses activities, the Company recorded asset impairment charges of $847 million and $344 million in 2001 and 2000, respectively. The majority of these asset impairment charges were in SPS. The impact of these asset impairments on depreciation expense was minimal in 2001, as the majority of the impaired assets are "held for use" and depreciation will continue into 2002 when the assets will be taken out of service.
In 2002, the Company expects capital expenditures to increase approximately 20% to $1.6 billion. However, capital expenditures by SPS are expected to be significantly lower than in 2001. In 2002, the full-year impact of SPS capital expenditures made in the year 2000 will result in an increase in depreciation expense. However, this increase is anticipated to be offset by reduced depreciation due to asset impairments recorded throughout 2001, as well as the overall impact of lower capital expenditures in 2001 and 2002 than in 2000. As a result, the Company expects depreciation expense in 2002 to be approximately the same as in 2001.
Reorganization of businesses
Total reorganization of businesses charges in 2001 were $2.9 billion, including $1.9 billion reflected on the consolidated statementsunder Reorganization of operations under "Reorganization of businesses"Businesses and $1.0 billion included in "Manufacturing and other costsCosts of sales".Sales. Total reorganization of businesses charges in 2000 were $1.5 billion, including $596 million reflected under "ReorganizationReorganization of businesses"Businesses and $887 million included in "Manufacturing and other costsCosts of sales." Expenses included under "Reorganization of businesses" include plans to discontinue product lines, exit businesses and consolidate manufacturing operations. The reorganizationSales. Reorganization of businesses charges included under "Manufacturingcosts associated with workforce reductions, product line discontinuations, business exits, and other costsconsolidation of sales" include inventory write downsmanufacturing and severance charges for direct labor employees.administrative operations. These charges are discussed in further detail in the "Reorganization of Businesses Programs" section below. The Company expects to record additional reorganization of businesses charges in 2002.
Other charges
Charges classified as "Other charges" on the consolidated statements of operations are comprised entirely of special items. Other chargesCharges were $3.3$2.1 billion in 2001 compared toand $517 million in 2000. Other charges in 2001 arewere primarily comprised ofof: (i) $1.5 billion for potentially uncollectible long-term finance receivables, $1.2of which $1.4 billion for impairments in the Company's investment portfolio,related to a $2.0 billion loan to Telsim, (ii) $398 million related to litigation and arbitration settlements, and $116of which $365 million related to goodwill and intangible asset impairments. Of the $1.5 billion of charges for potentially uncollectible long-term finance receivables, $1.4 billion relates to $2.0 billion in financing to Telsim, a wireless telephone operator in Turkey, that is currently in default. Of the $398 million of charges related to litigation and arbitration settlements, $365 million relates to an unfavorable court ruling relating to the Company's guarantee of a credit agreement for Iridium LLC. "Other charges"LLC, (iii) $116 million for goodwill and intangible asset impairments, primarily related to the Internet Software and Content Group, a business included in the Other Products segment, (iv) $45 million for contract termination charges, and (v) $40 million for in-process research and development charges relating to the acquisitions of Blue Wave Systems, Inc., included in the Integrated Electronic Systems segment, and RiverDelta Networks, Inc., included in the Broadband Communications segment.
Other charges in 2000 arewere comprised ofof: (i) $332 million for acquired in-process research and development charges, of which $214 million related to the acquisition of C-Port Corporation, included in the Semiconductor Products segment, (ii) $98 million for General Instrument merger integration costs, and (iii) $87 million for litigation and arbitration settlements. Due to the uncertain nature of the special items comprising "Other charges" it is not possible for the Company to estimate the potential impact of these items on 2002 results.
F-4 MANAGEMENT'S DISCUSSION AND ANALYSIS OF FINANCIAL CONDITION AND RESULTS OF OPERATIONS
Net interest expense
Net interest expense was $413 million in 2001, was $437compared to $171 million versus $248 million a year ago.in 2000. Net interest expense in 2001 includesincluded interest expense of $645$786 million, partially offset by interest income of $208$373 million. Net interest expense in 2000 includes $442 million ofincluded interest expense of $633 million, partially offset by $194 millioninterest income of interest income.$462 million. The increase in interest expense in 2001 compared to 2000 is attributed primarily to: (i) increased levels of long-term debt, reflecting the issuance of $5.2 billion of long-term debt during the fourth quarter of 2000 and throughout 2001;2001, (ii) an associated increase in the weighted average interest rate paid by the Company;Company, and (iii) interest expense associated with a $2 billion multi-draw term loan entered into by the Company in March 2001 that was repaid and terminated in the fourth quarter of 2001.
The Company expects netdecrease in interest expenseincome in 2001 compared to be approximately the same2000 is attributed primarily to a reduction in 2002 as in 2001.interest income earned on impaired long-term customer finance receivables.
Gains on sales of investments and businesses
Gains on sales of investments and businesses in 2001 were $1.9 billion in 2001, compared to $1.6 billion in 2000. The 2001 net gains in 2001 primarily resulted from the Company's sale of its investments in several cellular operating companies outside the U.S., the Company's sale of its Integrated Information Systems Group and the sale of securities. In 2000, gains resulted primarily from the sale of securities andfrom: (i) the sale of investments in several cellular operating companies outside the U.S., (ii) the sale of the Integrated Information Systems Group and the Multiservice Networks Division, and (iii) the sale of equity securities of other companies held for investment purposes. The 2000 net gains primarily resulted from: (i) the sale of equity securities of other companies held for investment purposes, and (ii) the sale of investments in several cellular operating companies outside the U.S.
Other
Charges classified as Other, as presented in Other Income (Expense), were $1.2 billion in 2001, compared to $63 million in 2000. Other charges in 2001 primarily related to investment impairment charges related to the Company's investments in United Pan-Europe Communications n.v., Open TV Corporation, Telus Corporation, and Teledesic Corporation. Other charges in 2000 primarily related to the Company's share of losses incurred by its equity method investments.
Effective tax rate
The effective tax rate was 29% in 2001, compared torepresenting a $1.6 billion net tax benefit. The effective tax rate was 41% in 2000.2000, representing a $913 million net tax expense. The higher effective tax rate in 2000 iswas due primarily to higherthe write-off of non-deductible in-process research and development charges.costs that produced no tax benefits. The in-process
MANAGEMENT'S DISCUSSION AND ANALYSIS OF FINANCIAL CONDITION AND RESULTS OF OPERATIONS F-5
research and development costs were associated with acquisitions the Company made during 2000. The higher 2000 tax rate is also influenced by the fact that the Company had more earnings in the U.S., where taxes are higher, than in other regions and specialreorganization of businesses and other charges in countries where the Company could not realize associated tax benefits. In 2001, the Company's tax provision was a net tax benefit. The effective tax rate benefit iswas lower in 2001 due to the Company's overall loss position and the inability to recognize tax benefits on losses in certain foreign jurisdictions. The Company currently expects an effective tax rate for 2002 of approximately 34%. The increase in the tax rate in 2002 compared to 2001 is due to an anticipated mix shift in earnings by region.
Results of Operations2000 Compared to 1999
GAAP Results
| | Years ended | ||||||||||
|---|---|---|---|---|---|---|---|---|---|---|---|
| (in millions, except per share amounts) | December 31, 2000 | % of Sales | December 31, 1999 | % of Sale | |||||||
| Net sales | $ | 37,580 | $ | 33,075 | |||||||
| Percent change from prior year | 14% | 6% | |||||||||
| Costs and expenses | |||||||||||
| Manufacturing and other costs of sales | 23,628 | 62.9% | 20,631 | 62.4% | |||||||
| Selling, general and administrative expenses | 5,141 | 13.7% | 5,220 | 15.8% | |||||||
| Research and development expenditures | 4,437 | 11.8% | 3,560 | 10.8% | |||||||
| Depreciation expense | 2,352 | 6.3% | 2,243 | 6.8% | |||||||
| Reorganization of businesses | 596 | 1.6% | (226 | ) | -0.7% | ||||||
| Other charges | 517 | 1.4% | 1,406 | 4.3% | |||||||
| Interest expense, net | 248 | 0.7% | 138 | 0.4% | |||||||
| Gains on sales of investments and businesses | (1,570 | ) | -4.2% | (1,180 | ) | -3.6% | |||||
| Total costs and expenses | 35,349 | 31,792 | |||||||||
| Earnings before income taxes | 2,231 | 5.9% | 1,283 | 3.9% | |||||||
| Income tax provision | 913 | 392 | |||||||||
| Net earnings | $ | 1,318 | 3.5% | $ | 891 | 2.7% | |||||
| Diluted earnings per common share | $ | 0.58 | $ | 0.41 | |||||||
The results of operations shown above are presented in accordance with accounting principles generally accepted in the United States of America (GAAP).
MANAGEMENT'S DISCUSSION AND ANALYSIS OF FINANCIAL CONDITION AND RESULTS OF OPERATIONS F-5
Several Motorola businesses have been sold since the beginning of 1999. In 1999, the Company sold the Semiconductor Components Group, its North American Antenna Sites business and its non-silicon component manufacturing business. In 2000, the Company sold its electronic ballast business. The results below also exclude these exited businesses as well as results of: (i) the Integrated Information Systems Group, the Company's defense and government electronics business, and (ii) the Multiservice Networks Division, a provider of end-to-end managed network solutions, which were sold in 2001.Earnings (Loss)
The Company's resultsCompany incurred a loss before income taxes of $5.5 billion in 2001, compared with earnings before income taxes of $2.2 billion in 2000. After taxes, the Company incurred a net loss of $3.9 billion, or ($1.78) per share, in 2001, compared with net earnings of $1.3 billion, or $0.58 per share, in 2000.
The $7.7 billion decline in earnings before income taxes in 2001 was primarily attributed to: (i) net losses from operations include special items. Special items include employee severancein 2001 due to the deterioration of sales more quickly than the reduction in fixed costs, fixed asset impairments, litigation-related(ii) a $1.4 billion increase in reorganization of businesses charges, (iii) $1.5 billion in charges for potentially uncollectible finance receivables in 2001, and (iv) $1.2 billion in charges for investment impairments goodwill/intangible asset impairments, in-process researchin 2001, partially offset by: (i) a decline in SG&A expenditures of $1.0 billion, and development charges, goodwill amortization, other unusual charges and(ii) an increase of $361 million in gains on sales of investments and businesses. These special items resulted in a net charge of $651 million before income taxes, or $733 million after income taxes, in 2000 and $951 million before income taxes, or $684 million after income taxes, in 1999.
Results of Operations for Ongoing Businesses Excluding Special Items
The results of operations shown below exclude the results of businesses sold and special items from the GAAP results of operations for the years ended December 31, 2000 and December 31, 1999.
| | For the Year Ended December 31, 2000 | |||||||||||||||||
|---|---|---|---|---|---|---|---|---|---|---|---|---|---|---|---|---|---|---|
| (in millions, except per share amounts) | GAAP Results | % of Sales | Special Items Inc/(Exp) | Exited Businesses Inc/(Exp) | Ongoing Operations Excluding Special Items | % of Sales | ||||||||||||
| Net sales | $ | 37,580 | $ | — | $ | 825 | $ | 36,755 | ||||||||||
| Costs and expenses | ||||||||||||||||||
| Manufacturing and other costs of sales | 23,628 | 62.9 | % | (887 | ) | (555 | ) | 22,186 | 60.4 | % | ||||||||
| Selling, general and administrative expenses | 5,141 | 13.7 | % | (221 | ) | (180 | ) | 4,740 | 12.9 | % | ||||||||
| Research and development expenditures | 4,437 | 11.8 | % | — | (57 | ) | 4,380 | 11.9 | % | |||||||||
| Depreciation expense | 2,352 | 6.3 | % | — | (25 | ) | 2,327 | 6.3 | % | |||||||||
| Reorganization of businesses | 596 | 1.6 | % | (596 | ) | — | — | — | ||||||||||
| Other charges | 517 | 1.4 | % | (517 | ) | — | — | — | ||||||||||
| Interest expense, net | 248 | 0.7 | % | — | — | 248 | 0.7 | % | ||||||||||
| Gains on sales of investments and businesses | (1,570 | ) | -4.2 | % | 1,570 | — | — | — | ||||||||||
| Total costs and expenses | 35,349 | (651 | ) | (817 | ) | 33,881 | ||||||||||||
| Earnings (loss) before income taxes | 2,231 | 5.9 | % | (651 | ) | 8 | 2,874 | 7.8 | % | |||||||||
| Income tax provision | 913 | (82 | ) | (2 | ) | 829 | ||||||||||||
| Net earnings (loss) | $ | 1,318 | 3.5 | % | $ | (733 | ) | $ | 6 | $ | 2,045 | 5.6 | % | |||||
| Diluted earnings per common share | $ | 0.58 | $ | 0.91 | ||||||||||||||
F-6 MANAGEMENT'S DISCUSSION AND ANALYSIS OF FINANCIAL CONDITION AND RESULTS OF OPERATIONS
| | For the Year Ended December 31, 1999 | |||||||||||||||||
|---|---|---|---|---|---|---|---|---|---|---|---|---|---|---|---|---|---|---|
| (in millions, except per share amounts) | GAAP Results | % of Sales | Special Items Inc/(Exp) | Exited Businesses Inc/(Exp) | Ongoing Operations Excluding Special Items | % of Sales | ||||||||||||
| Net sales | $ | 33,075 | $ | — | $ | 1,961 | $ | 31,114 | ||||||||||
| Costs and expenses | ||||||||||||||||||
| Manufacturing and other costs of sales | 20,631 | 62.4 | % | (820 | ) | (1,372 | ) | 18,439 | 59.3 | % | ||||||||
| Selling, general and administrative expenses | 5,220 | 15.8 | % | (131 | ) | (346 | ) | 4,743 | 15.2 | % | ||||||||
| Research and development expenditures | 3,560 | 10.8 | % | — | (69 | ) | 3,491 | 11.2 | % | |||||||||
| Depreciation expense | 2,243 | 6.8 | % | — | (32 | ) | 2,211 | 7.1 | % | |||||||||
| Reorganization of businesses | (226 | ) | -0.7 | % | 226 | — | — | — | ||||||||||
| Other charges | 1,406 | 4.3 | % | (1,406 | ) | — | — | — | ||||||||||
| Interest expense, net | 138 | 0.4 | % | — | (4 | ) | 134 | 0.4 | % | |||||||||
| Gains on sales of investments and businesses | (1,180 | ) | -3.6 | % | 1,180 | — | — | — | ||||||||||
| Total costs and expenses | 31,792 | (951 | ) | (1,823 | ) | 29,018 | ||||||||||||
| Earnings (loss) before income taxes | 1,283 | 3.9 | % | (951 | ) | 138 | 2,096 | 6.7 | % | |||||||||
| Income tax provision | 392 | 267 | (51 | ) | 608 | |||||||||||||
| Net earnings (loss) | $ | 891 | 2.7 | % | $ | (684 | ) | $ | 87 | $ | 1,488 | 4.8 | % | |||||
| Diluted earnings per common share | $ | 0.41 | $ | 0.68 | ||||||||||||||
Sales
Sales in 2000 were $37.6 billion, up 14% from $33.1 billion in 1999. Sales growth was attributed primarily to increased unit sales of digital wireless telephones, increased wireless infrastructure sales and increased sales of digital cable systems and high-speed data products. Businesses that have been sold since the beginning of 1999 accounted for $825$23 million of sales in 2000 and $1.96 billion$8 million of sales in 1999.
Geographic market sales, measured by the locale of the end customer, as a percent of total sales, for 2000 and 1999 were as follows:
Geographic Market Sales by Locale of End Customer
| | 2000 | 1999 | |||
|---|---|---|---|---|---|
| United States | 42 | % | 40 | % | |
| Europe | 16 | % | 20 | % | |
| China | 12 | % | 10 | % | |
| Latin America | 8 | % | 8 | % | |
| Asia, excluding China and Japan | 8 | % | 9 | % | |
| Japan | 6 | % | 7 | % | |
| Other Markets | 8 | % | 6 | % | |
| 100 | % | 100 | % | ||
Earnings before income taxes
Earnings before income taxes were $2.2 billion in 2000, compared with $1.3 billion in 1999. Net earnings were $1.3 billion, or 58 cents per share, in 2000 compared with $891 million, or 41 cents per share, in 1999. The $948 million increase in earnings before income taxes in 2001 and 2000, compared to 1999 was primarily attributed to: (i) a $1.5 billion increase in gross margin, resulting from higher sales volume in 2000 than in 1999; (ii) a decrease in other charges of $889 million in 2000, primarily attributable to Iridium-related charges in 1999, net of higher in-process research and development charges in 2000; and (iii) a $390 million increase in gains on sales of investments and businesses in 2000 compared to 1999. These improvements in earnings were partially offset by: (i) an $877 million increase in research and development charges; (ii) an $822 million increase in reorganization of businesses charges; and (iii) a $110 million increase in net interest costs in 2000 compared to 1999. The main businesses contributing to this improvement in earnings in 2000 were the Global Telecom Solutions and Broadband Communications segments.respectively.
Manufacturing and other costs of sales
Manufacturing and other costs of sales were $23.6 billion, or 62.9% of sales, in 2000 compared to $20.6 billion, or 62.4% of sales, in 1999. Manufacturing and other costs of sales in 2000 include $887 million of special charges, primarily for product portfolio simplification write-offs in the Personal Communications segment. Manufacturing and other costs of sales in 1999 included special charges of $820 million, primarily for inventory charges related to the Iridium project.
Excluding the impact of exited businesses and special charges, manufacturing and other costs of sales as a percent of sales were 60.4% of sales in 2000 compared to 59.3% of
MANAGEMENT'S DISCUSSION AND ANALYSIS OF FINANCIAL CONDITION AND RESULTS OF OPERATIONS F-7
sales in 1999. This increase in 2000 was due to higher manufacturing costs in the Personal Communications and Semiconductor Products segments.
Selling, general and administrative expenses
Selling, general and administrative expenses were $5.1 billion, or 13.7% of sales, in 2000 compared to $5.2 billion, or 15.8% of sales, in 1999. Selling, general and administrative expenses included $221 million and $131 million of special charges in 2000 and 1999, respectively. The 2000 special charges were comprised primarily of amortization of goodwill which increased from $119 million in 1999 to $170 million in 2000 as a result of acquisition of businesses. Excluding the impact of exited businesses and special charges, selling, general and administrative expenses remained flat at $4.7 billion.
Research and development expenditures
Research and development expenditures increased to $4.4 billion, or 11.8% of sales, in 2000 from $3.6 billion, or 10.8% of sales, in 1999. The increase in research and development expenditures was primarily related to expenditures in the Global Telecom Solutions segment.
Depreciation expense
Depreciation expense increased slightly to $2.4 billion in 2000 compared to $2.2 billion in 1999. Capital asset expenditures were $4.1 billion in 2000 versus $2.9 billion in 1999. Capital expenditures in the Semiconductor Products segment (SPS) were $2.4 billion, or approximately 58% of total capital expenditures, as compared to $1.5 billion of capital expenditures by SPS in 1999. In SPS, an extended period of time is often required to prepare assets for their intended use. The majority of the SPS capital expenditures in 2000 did not commence depreciation until the latter half of 2001 due to required modifications and the realignment of manufacturing facilities in SPS. As a result, these capital expenditures had a minimal impact on depreciation expense in 2000. In connection with reorganization of businesses activities, the Company recorded asset impairment charges of $344 million in 2000 primarily in SPS. The impact of these asset impairments on depreciation expense was minimal in 2000, as the majority of the impaired assets were "held for use" and, accordingly, depreciation continued.
Reorganization of businesses
Total reorganization of businesses charges in 2000 were $1.5 billion, including $596 million reflected on the consolidated statements of operations under "Reorganization of businesses" and $887 million reflected in "Manufacturing and other costs of sales". In 1999, $226 million of excess accruals relating to the completed 1998 reorganization of businesses program were reversed into income. The reorganization of businesses programs in 2000 included plans to discontinue product lines, exit businesses and consolidate manufacturing operations. These charges are discussed in further detail in the "Reorganization of Businesses Programs" section below.
Other charges
Charges classified as "Other charges" on the consolidated statements of operations were $517 million in 2000, compared to $1.4 billion in 1999. "Other charges" in 2000 included: (i) $332 million for in-process research and development charges; (ii) $98 million of acquisition and integration costs in connection with the merger with General Instrument Corporation; and (iii) $87 million for costs related to an unfavorable arbitration ruling with respect to a license agreement. "Other charges" in 1999 included: (i) $1.2 billion for Iridium-related charges; (ii) $67 million for in-process research and development charges; (iii) $105 million of compensation-related charges associated with the initial public offering of Next Level Communications, Inc.; and (iv) a $58 million charge related to an unfavorable arbitration ruling with respect to a license agreement.
Net interest expense
Net interest expense in 2000 was $248 million versus $138 million in 1999. Net interest expense in 2000 included $442 million of interest expense offset by $194 million of interest income. Net interest expense in 1999 included $276 million of interest expense offset by $138 million of interest income. The increase in net interest expense in 2000 was attributed to increased levels of short-term borrowings and long-term debt to finance capital expenditures, acquisitions and operating activities.
Gains on sales of investments and businesses
Gains on sales of investments and businesses in 2000 were $1.6 billion compared to $1.2 billion in 1999. The 2000 gains resulted primarily from the sale of securities and the sale of investments in several cellular operating companies outside the U.S. The 1999 gains resulted primarily from the sales of: (i) the Company's North American Antenna Site business, (ii) the Company's Semiconductor Components Group, and (iii) securities from the Company's investment portfolio.
Effective tax rate
The effective income tax rate was 41% in 2000, compared to 31% in 1999. The higher tax rate in 2000 was due primarily to non-deductible acquisition charges and special charges in countries where the Company was unable to realize associated tax benefits.
Reorganization of Businesses Programs
During the second half ofBeginning in 2000 and throughout 2001,through 2002, the Company implementedannounced plans to reduce its workforce, discontinue product lines, exit businesses and consolidate manufacturing operations. The Company initiated these plans in an effort to reduce costs and simplify its product portfolio. Cost savings realized in 2002 for the plans implemented in 2002 were approximately $187 million, of which $174 million, or 93%, are associated with reduced employee salaries and related employee costs resulting from the employee separation actions discussed below. Beyond 2002, the Company expects these 2002 reorganization of businesses programs to provide annualized incremental cost savings of approximately $475 million, of which the majority is associated with reduced employee salaries and related employee costs resulting from the employee separation actions.
The Company recorded provisions for employee separation costs and exit costs based on estimates prepared at the time the restructuring plans were approved by management. Exit costs primarily consist of future minimum lease payments on vacated facilities and facility closure costs. Employee separation costs consist primarily of severance. At each reporting date, the Company evaluates its accruals for exit costs and employee separation to ensure that the accruals are still appropriate. In certain circumstances, accruals are no longer required because of efficiencies in carrying out the plans or because employees previously identified for separation resigned from the Company unexpectedly and did not receive severance or were redeployed due to circumstances not foreseen when the original plans were initiated. The Company reverses accruals to income when it is determined they are no longer required.
F-8For the Year Ended December 31, 2002
For the year ended December 31, 2002, the Company recorded net charges of $1.8 billion, of which $56 million was included in Costs of Sales and $1.8 billion was recorded under Reorganization of Businesses in the Company's consolidated statements of operations. The aggregate $1.8 billion charge is comprised of the following:
| | Exit Costs | Employee Separations | Asset Writedowns | Total | |||||||||
|---|---|---|---|---|---|---|---|---|---|---|---|---|---|
| Discontinuation of product lines | $ | (23 | ) | $ | — | $ | — | $ | (23 | ) | |||
| Business exits | 27 | (2 | ) | — | 25 | ||||||||
| Manufacturing & administrative consolidations | 75 | 363 | 1,380 | 1,818 | |||||||||
| $ | 79 | $ | 361 | $ | 1,380 | $ | 1,820 | ||||||
Discontinuation of product lines
During 2002, the Company reversed $23 million of accruals. This reversal primarily consisted of $14 million by the Commercial, Government and Industrial Solutions segment and $5 million by the Global Telecom Solutions segment related to customer and vendor liabilities arising from product cancellations that were negotiated and settled for less than the amounts originally claimed.
Business Exits
During 2002, the Company incurred a net charge of $25 million relating to business exits. The $27 million net charge for exit costs consisted primarily of: (i) a $55 million charge in the Global Telecom Solutions segment for exit costs relating to a lease cancellation fee; (ii) $19 million of reversals into income in the Other Products segment for exit cost accruals, mainly related to the exit of the Multiservice Networks Division; and (iii) a $12 million reversal in the Commercial, Government and Industrial Solutions segment
F-6 MANAGEMENT'S DISCUSSION AND ANALYSIS OF FINANCIAL CONDITION AND RESULTS OF OPERATIONS
lines,related to the completion of exit businessesactivities for its smartcard business.
Manufacturing and Administrative Consolidations
The Company's actions to consolidate manufacturing operations and to reduce costsimplement strategic initiatives to streamline its global organization resulted in a net charge of $1.8 billion for the year ended December 31, 2002. The charge consisted primarily of: (i) $1.1 billion in the Semiconductor Products segment for consolidation activities focused primarily on manufacturing facilities in Arizona, China, and simplify its product portfolio.
Associated annual cost savingsScotland in connection with the implementation of the "asset-light" semiconductor business model; (ii) $182 million in the Personal Communications segment, primarily related to the announced reorganizationshut-down of businesses programsan engineering and distribution center in Illinois; (iii) $156 million in the Global Telecom Solutions segment, primarily related to segment-wide employee separation costs; and (iv) $340 million for employee separation, fixed asset impairments and lease cancellation fees across all other segments.
Reorganization of Businesses Charges—by Segment
The following table displays the net charges incurred by segment for the year ended December 31, 2002:
| Segment | Exit Costs | Employee Separations | Asset Writedowns | Total | ||||||||
|---|---|---|---|---|---|---|---|---|---|---|---|---|
| Personal Communications | $ | (5 | ) | $ | 70 | $ | 119 | $ | 184 | |||
| Semiconductor Products | — | 2 | 1,145 | 1,147 | ||||||||
| Global Telecom Solutions | 56 | 128 | 25 | 209 | ||||||||
| Commercial, Government and Industrial Solutions | (16 | ) | 58 | 3 | 45 | |||||||
| Broadband Communications | 4 | 37 | 9 | 50 | ||||||||
| Integrated Electronic Systems | 24 | 20 | 23 | 67 | ||||||||
| Other Products | (8 | ) | 19 | 7 | 18 | |||||||
| General Corporate | 24 | 27 | 49 | 100 | ||||||||
| $ | 79 | $ | 361 | $ | 1,380 | $ | 1,820 | |||||
Reorganization of Businesses Accruals
The following table displays a rollforward of the accruals established for exit costs from January 1, 2002 to December 31, 2002:
| Exit Costs | Accruals at January 1, 2002 | 2002 Net Charges | 2002 Amount Used | Accruals at December 31, 2002 | ||||||||
|---|---|---|---|---|---|---|---|---|---|---|---|---|
| Discontinuation of product lines | $ | 54 | $ | (23 | ) | $ | (25 | ) | $ | 6 | ||
| Business exits | 108 | 27 | (53 | ) | 82 | |||||||
| Manufacturing & administrative consolidations | 141 | 75 | (87 | ) | 129 | |||||||
| $ | 303 | $ | 79 | $ | (165 | ) | $ | 217 | ||||
The 2002 net charges of $79 million represent $156 million of additional charges and $77 million of reversals into income. The 2002 amount used of $165 million reflects cash payments of $162 million and non-cash utilization of $3 million. The remaining accrual of $217 million, which is included in Accrued Liabilities in the Company's consolidated balance sheets, represents future cash payments, primarily for lease termination obligations, which will extend over several years.
The following table displays a rollforward of the accruals established for employee separation costs from January 1, 2002 to December 31, 2002:
| Employee Separation Costs | Accruals at January 1, 2002 | 2002 Net Charges | 2002 Amount Used | Accruals at December 31, 2002 | ||||||||
|---|---|---|---|---|---|---|---|---|---|---|---|---|
| Business exits | $ | 7 | $ | (2 | ) | $ | (5 | ) | $ | — | ||
| Manufacturing & administrative consolidations | 605 | 363 | (549 | ) | 419 | |||||||
| $ | 612 | $ | 361 | $ | (554 | ) | $ | 419 | ||||
At January 1, 2002, the Company had an accrual of $612 million for employee separation costs, representing the severance costs for approximately 12,500 employees, of which 7,700 were direct employees and 4,800 were indirect employees. The 2002 net charges of $361 million represent additional charges of $502 million and reversals into income
MANAGEMENT'S DISCUSSION AND ANALYSIS OF FINANCIAL CONDITION AND RESULTS OF OPERATIONS F-7
of $141 million. The additional charges of $502 million represent the severance costs for approximately 9,700 employees, of which 3,100 are direct employees and 6,600 are indirect employees. The accrual is for various levels of employees. The reversals into income of $141 million represent the severance costs for approximately 1,800 employees previously identified for separation who resigned from the Company unexpectedly and did not receive severance or were redeployed due to circumstances not foreseen when the original plans were approved. Direct employees are primarily non-supervisory production employees and indirect employees are primarily non-production employees and production managers.
During 2002, approximately 13,200 employees, of which 6,400 were direct employees and 6,800 were indirect employees, were separated from the Company. The 2002 amount used of $554 million reflects $534 million of cash payments to these separated employees and $20 million of non-cash utilization. The remaining accrual of $419 million, which is included in Accrued Liabilities in the Company's consolidated balance sheets, is expected to be paid to approximately $3.0 billion7,200 separated employees by the end of 2002. Cumulative cost savings benefits realized through2003.
For the year Ended December 31, 2001 were approximately $1.5 billion. Approximately 85% of the cost savings to date are associated with employee salaries and related employee costs resulting from the employee separation actions discussed below. The Company expects to record additional charges in 2002.
2001 Reorganization of Businesses Charges
As a result of these plans, inFor the year ended December 31, 2001, the Company recorded net charges of $2.9 billion, of which $1.0 billion was included in "Manufacturing and other costsCosts of sales"Sales and $1.9 billion was recorded under "ReorganizationReorganization of businesses"Businesses in the Company's consolidated statements of operations. The aggregate $2.9 billion charge is comprised of the following (in millions):following:
| | Exit Costs | Employee Separations | Inventory Writedowns | Asset Writedowns | Total | |||||||||||
|---|---|---|---|---|---|---|---|---|---|---|---|---|---|---|---|---|
| Discontinuation of product lines | $ | 44 | $ | — | $ | 449 | $ | 92 | $ | 585 | ||||||
| Business exits | 151 | — | 30 | 25 | 206 | |||||||||||
| Manufacturing & administrative consolidations | 196 | 1,118 | 41 | 730 | 2,085 | |||||||||||
| Totals | $ | 391 | $ | 1,118 | $ | 520 | $ | 847 | $ | 2,876 | ||||||
The majority of the 2001 reorganization of businesses charges were incurred in the Personal Communications segment, with $969 million, the Semiconductor Products segment, with $841 million, and the Global Telecom Solutions segment, with $345 million.
| | Exit Costs | Employee Separations | Inventory Writedowns | Asset Writedowns | Total | ||||||||||
|---|---|---|---|---|---|---|---|---|---|---|---|---|---|---|---|
| Discontinuation of product lines | $ | 44 | $ | — | $ | 449 | $ | 92 | $ | 585 | |||||
| Business exits | 151 | — | 30 | 25 | 206 | ||||||||||
| Manufacturing & administrative consolidations | 196 | 1,118 | 41 | 730 | 2,085 | ||||||||||
| $ | 391 | $ | 1,118 | $ | 520 | $ | 847 | $ | 2,876 | ||||||
Discontinuation of Product Lines
During 2001, the Company discontinued a number ofCompany's plan to discontinue certain product lines resultingresulted in a net chargecharges of $585 million. This charge consisted primarily of $427 million of these charges were in the Personal Communications segment, principally for: (i)for an additional writedown of the value of inventory relating to the discontinuation of analog and first-generation digital wireless telephones necessitated due to the accelerated erosion of average selling prices for these products in early 2001 and (ii) the discontinuation of two-way messaging and one-way paging products. The remaining charges consisted primarily of: (i) $68 million in the Broadband Communications segment, principally for inventory writedowns related to the discontinuation of analog set-top box products; (ii) $23 million in the Semiconductor Products segment, principally for the discontinuationdiscontinuance of certain 5-inch and 6-inch wafer manufacturing technologies; and (iii) $37 million in the Commercial, Government and Industrial Solutions segment, principally for the discontinuation of a product line intended to serve shared public trunked radio customers. These charges included exit costs for vendor and customer liabilities arising from product cancellations. Some of these contractual obligations may extend over several years.
Business Exits
During 2001, the Company incurred a net charge of $206 million relating to business exits. This charge consisted of: (i) $90 million in the Global Telecom Solutions segment relating to an operating joint venture in Japan; (ii) $39 million for the exit of the smartcard business in the Commercial, Government and Industrial Solutions segment for the exit of certain activities relating to the smartcard business;segment; and (iii) $77 million in the Other Products segment to cease the development and sale of voice-recognitionvoice recognition systems and Wireless Application Protocol servers, andas well as the exit of the Multiservice Networks Division. The exit costs included customer and supplier termination costs and lease payment and cancellation costs. Some of these contractual obligations may extend over several years. Aggregate sales in 2001 from these exited businesses were approximately $129 million. Aggregate losses were $100 million.
Manufacturing and Administrative Consolidations
The Company's actions to consolidate manufacturing operations and to implement strategic initiatives to streamline its global organization resulted in a net charge of $2.1 billion infor the year ended December 31, 2001. The charge consisted primarily of $542 million in the Personal Communications segment and $818 million in the Semiconductor Products segment for severance benefit costs, asset impairments and lease cancellation fees. Some of the lease obligations, which are included in exit costs, may extend over several years. The remaining $725 million of charges were primarily for severance benefit costs in other segments. The consolidation activities were focused primarily onon: (i) the shut-down of manufacturing operations in Scotland, Illinois and Florida in the Personal Communications segment, and(ii) the consolidation of portions of the Semiconductor Products segment's manufacturing operations in various locations, including Texas, Arizona, Hong Kong, and Japan, as well asand (iii) the reduction of non-manufacturing headcountworkforce across all segments.
F-8 MANAGEMENT'S DISCUSSION AND ANALYSIS OF FINANCIAL CONDITION AND RESULTS OF OPERATIONS F-9
2001 Reorganization of Businesses AccrualsCharges—by Segment
The following tables display rollforwardstable displays the net charges incurred by segment for the year ended December 31, 2001:
| Segment | Exit Costs | Employee Separations | Inventory Writedowns | Asset Writedowns | Total | ||||||||||
|---|---|---|---|---|---|---|---|---|---|---|---|---|---|---|---|
| Personal Communications | $ | 97 | $ | 208 | $ | 409 | $ | 255 | $ | 969 | |||||
| Semiconductor Products | 12 | 386 | — | 443 | 841 | ||||||||||
| Global Telecom Solutions | 123 | 155 | 25 | 42 | 345 | ||||||||||
| Commercial, Government and Industrial Solutions | 45 | 97 | 22 | 36 | 200 | ||||||||||
| Broadband Communications | 19 | 53 | 51 | 23 | 146 | ||||||||||
| Integrated Electronic Systems | 18 | 103 | 1 | 19 | 141 | ||||||||||
| Other Products | 69 | 34 | 12 | 27 | 142 | ||||||||||
| General Corporate | 8 | 82 | — | 2 | 92 | ||||||||||
| $ | 391 | $ | 1,118 | $ | 520 | $ | 847 | $ | 2,876 | ||||||
Reorganization of Businesses Accruals
The following table displays a rollforward of the accruals established for exit costs and employee separation costs from January 1, 2001 to December 31, 2001:
| Exit Costs | Accruals at January 1, 2001 | 2001 Net Charges | 2001 Amount Used | Accruals at December 31, 2001 | Accruals at January 1, 2001 | 2001 Net Charges | 2001 Amount Used | Accruals at December 31, 2001 | ||||||||||||||||
|---|---|---|---|---|---|---|---|---|---|---|---|---|---|---|---|---|---|---|---|---|---|---|---|---|
| Discontinuation of product lines | $ | 55 | $ | 44 | $ | (45 | ) | $ | 54 | $ | 55 | $ | 44 | $ | (45 | ) | $ | 54 | ||||||
| Business exits | 32 | 151 | (75 | ) | 108 | 32 | 151 | (75 | ) | 108 | ||||||||||||||
| Manufacturing & administrative consolidations | 61 | 196 | (116 | ) | 141 | 61 | 196 | (116 | ) | 141 | ||||||||||||||
| $ | 148 | $ | 391 | $ | (236 | ) | $ | 303 | $ | 148 | $ | 391 | $ | (236 | ) | $ | 303 | |||||||
The 2001 amount used of $236 million reflects cash payments of $153 million and non-cash utilization of $83 million. The remaining accrual ofat December 31, 2001 was $303 million, which isand was included in accrued liabilitiesAccrued Liabilities in the Company's consolidated balance sheets, representssheets. In 2002, the Company utilized $151 million of the accrual, reversed $74 million and expects $78 million in future cash payments expectedprimarily to be substantially completed byin 2003. Included in the endabove amount are payments for outstanding lease termination obligations, which will extend over several years.
The following table displays a rollforward of 2002.the accruals established for employee separation costs from January 1, 2001 to December 31, 2001:
| Employee Separation Costs | Accruals at January 1, 2001 | 2001 Net Charges | 2001 Amount Used | Accruals at December 31, 2001 | Accruals at January 1, 2001 | 2001 Net Charges | 2001 Amount Used | Accruals at December 31, 2001 | ||||||||||||||||
|---|---|---|---|---|---|---|---|---|---|---|---|---|---|---|---|---|---|---|---|---|---|---|---|---|
| Business exits | $ | 27 | $ | — | $ | (20 | ) | $ | 7 | $ | 27 | $ | — | $ | (20 | ) | $ | 7 | ||||||
| Manufacturing & administrative consolidations | 88 | 1,118 | (601 | ) | 605 | 88 | 1,118 | (601 | ) | 605 | ||||||||||||||
| $ | 115 | $ | 1,118 | $ | (621 | ) | $ | 612 | $ | 115 | $ | 1,118 | $ | (621 | ) | $ | 612 | |||||||
At January 1, 2001, the Company had an accrual of $115 million for employee separation costs, representing the severance costs for approximately 3,300 employees, of which 1,900 were direct employees and 1,400 were indirect employees. The 2001 net charges of $1.1 billion for employee separation costs represent the severance costs for approximately an additional 38,700 employees, of which 25,300 are direct employees and 13,400 are indirect employees. The accrual is for various levels of employees. Direct employees are primarily non-supervisory production employees and indirect employees are primarily non-production employees and production managers. Included in the December 31, 2001 accrual is severance cost for officers of the Company which have a substantially higher average severance cost per employee than direct and other indirect employees.
During 2001, approximately 29,500 employees, of which 19,800 were direct employees and 9,700 were indirect employees, were separated from the Company. The 2001 amount used of $621 million reflects cash payments to these separated employees. The remaining accrual ofat December 31, 2001 was $612 million which isand was included in accrued liabilitiesAccrued Liabilities in the Company's consolidated balance sheets, is expectedsheets. In 2002, the Company utilized $421 million of the accrual, reversed $128 million and expects $63 million in future cash payments to be paid to approximately 12,500 separated employees by the endsecond quarter of 2002.2003.
MANAGEMENT'S DISCUSSION AND ANALYSIS OF FINANCIAL CONDITION AND RESULTS OF OPERATIONS F-9
For the Year Ended December 31, 2000 Reorganization of Businesses Charges
During the second half of 2000, the Company recorded a net charge of $1.5 billion for reorganization of businesses, of which $887 million was included in "Manufacturing and other costsCosts of sales"Sales and $596 million was recorded under "ReorganizationReorganization of businesses"Businesses in the Company's consolidated statements of operations. The aggregate $1.5 billion charge is comprised of the following:
| | Exit Costs | Employee Separations | Inventory Writedowns | Asset Writedowns | Total | ||||||||||
|---|---|---|---|---|---|---|---|---|---|---|---|---|---|---|---|
| Discontinuation of product lines | $ | 57 | $ | — | $ | 765 | $ | 266 | $ | 1,088 | |||||
| Business exits | 56 | 44 | 56 | 52 | 208 | ||||||||||
| Manufacturing & administrative consolidations | 61 | 96 | 4 | 26 | 187 | ||||||||||
| $ | 174 | $ | 140 | $ | 825 | $ | 344 | $ | 1,483 | ||||||
F-10 MANAGEMENT'S DISCUSSION AND ANALYSIS OF FINANCIAL CONDITION AND RESULTS OF OPERATIONS
The majority of the 2000 reorganization of businesses charges were incurred in the Personal Communications segment, with $838 million, the Semiconductor Products segment, with $274 million, and the Global Telecom Solutions segment, with $131 million.
| | Exit Costs | Employee Separations | Inventory Writedowns | Asset Writedowns | Total | ||||||||||
|---|---|---|---|---|---|---|---|---|---|---|---|---|---|---|---|
| Discontinuation of product lines | $ | 57 | $ | — | $ | 765 | $ | 266 | $ | 1,088 | |||||
| Business exits | 56 | 44 | 56 | 52 | 208 | ||||||||||
| Manufacturing & administrative consolidations | 61 | 96 | 4 | 26 | 187 | ||||||||||
| $ | 174 | $ | 140 | $ | 825 | $ | 344 | $ | 1,483 | ||||||
Discontinuation of Product Lines
The Company's plan to discontinuestreamline certain product lines resulted in a net charge of $1.1 billion infor the year ended December 31, 2000. This charge was comprised of the following:of: (i) a writedown of the value of inventory for discontinued analog and first-generation digital wireless telephones and customer and supplier termination costs in the Personal Communications segment; (ii) charges for the discontinuation of certain 5-inch and 6-inch wafer manufacturing technologies in the Semiconductor Products segment; and (iii) charges for the discontinuation of certain fixed wireless infrastructure products in the Global Telecom Solutions segment. The exit costs included in the charge represent vendor and customer liabilities arising from product cancellations.
Business Exits
During the year ended December 31, 2000, the Company incurred a net charge of $208 million relating to business exits. These charges primarily related to costs incurred in connection withwith: (i) the exit of thea joint venture, SpectraPoint Wireless LLC, joint venture bywithin the Global Telecom Solutions segment; (ii) the exit of the asynchronous digital subscriber line business, which manufactured chips for high-speed Internet access, bywithin the Semiconductor Products segment; (iii) the exit of the flat panel display business, inwithin the Other Products segment; and (iv) the exit of certain activities of the smartcard business, inwithin the Commercial, Government and Industrial Solutions segment. The exit costs included in the charge represent customer and supplier termination costs and lease payment and cancellation costs. Annual cost savings from these business exits are approximately $150 million.
Manufacturing and Administrative Consolidations
The Company's plan to consolidate manufacturing operations and streamline the internal supply-chain capacity resulted in a net charge of $187 million infor the year ended December 31, 2000. The charge consisted primarily of severance benefit costs, asset impairments and lease cancellation fees. The consolidation activities were focused primarily on the shut-down of: (i) manufacturing operations in Ireland, Germany and Florida by the Personal Communications segment; (ii) manufacturing operations in Ireland by the Integrated Electronic Systems segment; (iii) manufacturing operations in Iowa by the Commercial, Government and Industrial Solutions segment; and (iv) certain research labs in Arizona and California by the Semiconductor Products segment.
2000 Reorganization of Businesses AccrualsCharges—by Segment
The following tables display rollforwardstable displays the net charges incurred by segment for the year ended December 31, 2000:
| Segment | Exit Costs | Employee Separations | Inventory Writedowns | Asset Writedowns | Total | ||||||||||
|---|---|---|---|---|---|---|---|---|---|---|---|---|---|---|---|
| Personal Communications | $ | 69 | $ | 40 | $ | 694 | $ | 35 | $ | 838 | |||||
| Semiconductor Products | 28 | 5 | 4 | 237 | 274 | ||||||||||
| Global Telecom Solutions | 41 | 7 | 62 | 21 | 131 | ||||||||||
| Commercial, Government and Industrial Solutions | 14 | 31 | 1 | 6 | 52 | ||||||||||
| Broadband Communications | — | — | 20 | 10 | 30 | ||||||||||
| Integrated Electronic Systems | 1 | 11 | 28 | 3 | 43 | ||||||||||
| Other Products | 20 | 41 | 16 | 32 | 109 | ||||||||||
| General Corporate | 1 | 5 | — | — | 6 | ||||||||||
| $ | 174 | $ | 140 | $ | 825 | $ | 344 | $ | 1,483 | ||||||
F-10 MANAGEMENT'S DISCUSSION AND ANALYSIS OF FINANCIAL CONDITION AND RESULTS OF OPERATIONS
Reorganization of Businesses Accruals
The following table displays a rollforward of the accruals established for exit costs and employee separation costs from January 1, 2000 to December 31, 2000:
| Exit Costs | Accruals at January 1, 2000 | 2000 Net Charges | 2000 Amounts Used | Accruals at December 31, 2000 | Accruals at January 1, 2000 | 2000 Net Charges | 2000 Amounts Used | Accruals at December 31, 2000 | ||||||||||||||||
|---|---|---|---|---|---|---|---|---|---|---|---|---|---|---|---|---|---|---|---|---|---|---|---|---|
| Discontinuation of product lines | $ | — | $ | 57 | $ | (2 | ) | $ | 55 | $ | — | $ | 57 | $ | (2 | ) | $ | 55 | ||||||
| Business exits | 4 | 56 | (28 | ) | 32 | 4 | 56 | (28 | ) | 32 | ||||||||||||||
| Manufacturing & administrative consolidations | 12 | 61 | (12 | ) | 61 | 12 | 61 | (12 | ) | 61 | ||||||||||||||
| $ | 16 | $ | 174 | $ | (42 | ) | $ | 148 | $ | 16 | $ | 174 | $ | (42 | ) | $ | 148 | |||||||
The 2000 amount used of $42 million reflects cash payments of $39 million and non-cash utilization of $3 million. The remaining accrual ofat December 31, 2000 was $148 million, which isand was included in accrued liabilitiesAccrued Liabilities in the consolidated balance sheets, represents $117sheets. In 2002 and 2001, the Company utilized $122 million of cash payments made during 2001, $15the accrual, reversed $21 million of reversals into income of excess reservesand expects to pay $5 million in 2001, and $16 million of future cash payments expected to be made beyond 20012003 as a result of negotiated contractual payment terms.
| Employee Separation Costs | Accruals at January 1, 2000 | 2000 Net Charges | 2000 Amounts Used | Accruals at December 31, 2000 | ||||||||
|---|---|---|---|---|---|---|---|---|---|---|---|---|
| Business exits | $ | — | $ | 44 | $ | (17 | ) | $ | 27 | |||
| Manufacturing & administrative consolidations | 11 | 96 | (19 | ) | 88 | |||||||
| $ | 11 | $ | 140 | $ | (36 | ) | $ | 115 | ||||
The following table displays a rollforward of the accruals established for employee separation costs from January 1, 2000 to December 31, 2000:
| Employee Separation Costs | Accruals at January 1, 2000 | 2000 Net Charges | 2000 Amounts Used | Accruals at December 31, 2000 | ||||||||
|---|---|---|---|---|---|---|---|---|---|---|---|---|
| Business exits | $ | — | $ | 44 | $ | (17 | ) | $ | 27 | |||
| Manufacturing & administrative consolidations | 11 | 96 | (19 | ) | 88 | |||||||
| $ | 11 | $ | 140 | $ | (36 | ) | $ | 115 | ||||
The net charges of $140 million for employee separation costs represented the severance costs for approximately 3,900 employees, of which 2,100 were direct employees and 1,800 were indirect employees. Direct employees are primarily non-supervisory production employees and indirect employees are primarily non-production
MANAGEMENT'S DISCUSSION AND ANALYSIS OF FINANCIAL CONDITION AND RESULTS OF OPERATIONS F-11
employees and production managers. As of December 31, 2000, approximately 670 employees, of which 260 were direct employees and 410 were indirect employees, had separated from the Company. The 2000 amount used of $36 million reflected cash payments to these separated employees. The remaining accrual ofat December 31, 2000 was $115 million, which isand was included in accrued liabilitiesAccrued Liabilities in the consolidated balance sheets, represented cash payments that were made during 2001.
1999 Reorganization of Businesses Charges
sheets. In 1998,2001, the Company implemented a comprehensive plan to consolidate manufacturing operations, exit non-strategic and poorly-performing businesses, and reduce worldwide employment. No additional charges were taken in 1999 associated with this plan. This plan reached its planned completion at December 31, 1999, at which timeutilized the Company reversed into income $226 million for accruals no longer required.entire amount.
1999 Reorganization of Businesses Accruals
The following tables display rollforwards of the accruals established for exit costs and employee separation costs from January 1, 1999 to December 31, 1999:
| | Accruals at January 1, 1999 | 1999 Amounts Used | 1999 Reversals Into Income | Accruals at December 31, 1999 | |||||||||
|---|---|---|---|---|---|---|---|---|---|---|---|---|---|
| Business exits & asset impairments | $ | 298 | $ | (108 | ) | $ | (186 | ) | $ | 4 | |||
| Manufacturing & administrative consolidations | 155 | (143 | ) | — | 12 | ||||||||
| Employee separations | 187 | (136 | ) | (40 | ) | 11 | |||||||
| Totals | $ | 640 | $ | (387 | ) | $ | (226 | ) | $ | 27 | |||
The 1999 amount used of $387 million reflects cash payments of $189 million and $198 million in non-cash utilization. The remaining accrual of $27 million, which was included in accrued liabilities in the consolidated balance sheets, represented cash payments made in the first quarter of 2000.
As of December 31, 1999, approximately 19,400 employees had separated from the Company through a combination of voluntary and involuntary severance programs. Of these 19,400 separated employees, approximately 12,400 were direct employees and 7,000 were indirect employees. Direct employees are primarily non-supervisory production employees and indirect employees are primarily non-production employees and production managers. In addition, 4,200 employees separated from the Company with the sale of the non-silicon component manufacturing business. These 4,200 people were not paid any severance because the business was sold to another corporation.
In 1999, the Company reversed into income approximately $186 million for accruals no longer required for the contract requirements and contingencies related to: (i) the sale of its printed circuit board business; (ii) the sale of its non-silicon component manufacturing business; and (iii) the business pruning activities of the Semiconductor Products segment. The Company's successful employee redeployment efforts reduced the severance requirement in the fourth quarter of 1999. Therefore, the Company reversed into income in 1999 approximately $40 million of accruals no longer required for a cancelled separation plan involving approximately 500 employees.
Liquidity and Capital Resources
As highlighted in the Consolidated Statements of Cash Flows, the Company's liquidity and available capital resources are impacted by 4four key components: (i) current cash and cash equivalents, and short-term investments, (ii) operating activities, (iii) investing activities, and (iv) financing activities.
Cash and Cash Equivalents and Short-Term Investments
At December 31, 2001,2002, the Company's cash and cash equivalents (which are highly-liquid investments with an original maturity of 3three months or less) aggregated $6.1$6.5 billion, compared to $3.3$6.1 billion at December 31, 2000.2001. On December 31, 2001, $1.92002, $4.2 billion of the cash and cash equivalents werethis amount was held in the U.S. and $4.2$2.3 billion werewas held by the Company or its subsidiaries in other countries. In 2002, the Company repatriated approximately $3.0 billion of cash to the United States from overseas. Repatriation of some of theseadditional funds could be subject to delay and could have potential adverse tax consequences. In addition, the Company had $80 million in short-term investments, which are highly-liquid fixed-income investments with an original maturity greater than 3 months but less than one year, at December 31, 2001 compared to $354 million at December 31, 2000.
Operating Activities
In 2001,During the past 2 years, the Company has generated positive cash flow from operations for eight consecutive quarters. The cash provided by operating activities was $1.3 billion in 2002, compared to $2.0 billion in 2001. The Company used cash fromfor operations as compared toof $1.2 billion in cash used for operations in 2000 and $2.1 billion generated in 1999.2000. The primary contributors to the 2001 cash flow from operations in 2002 were: (i) net earnings (adjusted for non-cash items) of $2.0 billion, (ii) a net increase in other assets and liabilities of $252 million, and (iii) a decrease of $2.4 billion$155 million in accounts receivable, across all business segments;reflecting a decrease in four of the Company's six major segments, excluding the Global Telecom Solutions and the Semiconductor Products segments. These improvements were partially offset by: (i) a $980 million decrease in accounts payable and accrued liabilities, primarily attributed to: (a) reduced operating costs associated with the Company's cost-reduction activities, (b) cash payments for employee severance and exit costs, and (c) a $371 million funding guarantee payment relating to Iridium, and (ii) a $1.8$102 million increase in inventory.
The Company's net accounts receivable were $4.4 billion reductionat December 31, 2002, compared to $4.6 billion at December 31, 2001. The Company's weeks receivable, excluding net long-term finance receivables, improved to 7.0
F-12 MANAGEMENT'S DISCUSSION AND ANALYSIS OF FINANCIAL CONDITION AND RESULTS OF OPERATIONS F-11
in inventory, net of non-cash writedowns, occurring in the Personal Communications, Global Telecom Solutions and Semiconductor Products segments, and (iii) net earnings, adjusted for non-cash items, of $449 million, partially offset by a $3.0 billion decrease in accounts payable and accrued liabilities.
The Company's net accounts receivable was $4.6 billionweeks at December 31, 2001,2002, compared to $7.1 billion7.9 weeks at December 31, 2000. The Company's weeks receivable, excluding net long-term finance receivables, were 7.9 at December 31, 2001, compared to 8.9 at December 31, 2000.2001. The decrease in net accounts receivable compared to December 31, 2000 was primarily due to the improvement in weeks receivable and a decline in the Company's salesnet sales; however, the Company continued to show improvement in receivables management, as evidenced by the decline in weeks receivable for thefull year across all segments. For the full-year 2002 as compared to December 31, 2001, thefull year 2001. The Company expects net accounts receivable levels in 2003 to declinebe higher than net accounts receivable levels in 2002 due to lower annualthe expected increase in sales. Weeks receivable in 20022003 is expected to be equivalent to 2001.weeks receivable in 2002.
The Company's net inventory was $2.9 billion at December 31, 2002, compared to $2.8 billion at December 31, 2001, compared to $5.2 billion at December 31, 2000.2001. The Company's inventory turns (using the cost-of-sales calculation method) weredeclined to 5.8 at December 31, 2002, compared to 6.4 at December 31, 2001, compared to 5.0 at December 31, 2000.2001. The decrease inCompany expects net inventory includes non-cash writedowns of $583 million, primarily relatedlevels in 2003 to discontinued product linesbe lower than net inventory levels in 2002 due to improvement in the Personal Communications segment, recordedsupply-chain process. Inventory turns are expected to be higher in the first quarter of 2001. Additionally, the decrease2003 than in net inventory is due to shipments of end-of-life products and lower purchases of component parts, as well as increased inventory turns. For the full-year 2002 as compared to December 31, 2001, the Company expects inventory levels are expected to decrease in line with sales and inventory turns to remain fairly constant as it continues to improve its supply-chain management processes.decline. Inventory management continues to be an area of focus as the Company balances the need to maintain strategic inventory levels to ensure competitive lead-timesdelivery performance to its customers with the risk of inventory obsolescence due to rapidly changing technology and customer requirements.
Research and development expenditures declined 3% to $4.3 billion in 2001 compared to $4.4 billion in 2000. Research and development expenditures were lower in the Personal Communications, Semiconductor Products and Global Telecom Solutions segments. These reductions were partially offset by increased spending in corporate development projects. Despite an expected decline in sales in 2002, the Company continues to believe that a strong commitment to research and development is required to drive long-term growth as part of its core business strategy and expects to invest in research and development at approximately the same level in 2002 as in 2001.
To improve its future profitability, the Company implemented substantial cost-reduction and product-simplificationreorganization of businesses plans beginning in late 2000 and throughout 2001. These plans involve discontinuation of product lines, exits from businesses, and consolidation of manufacturing facilities.through 2002. Cash payments for exit costs and employee separations in connection with these plans were $774$696 million in 2001.2002. The Company expects the remaining $915$636 million reorganization of businesses accrual at December 31, 2001 to2002 will result in future cash payments. In addition,payments, the majority of which are expected to be paid in 2003.
No cash contribution to the regular U.S. pension plan was required in 2001 or 2002; however, the Company expects to record additional reorganizationmake a cash contribution of businesses chargesbetween $150 million and $200 million to this plan during 2003. Retirement related benefits are further discussed below in 2002, which are expected to result in additional cash payments.the "Significant Accounting Policies—Retirement Related Benefits" section.
Investing Activities
The most significant components of the Company's investing activities are: (i) capital expenditures, (ii) strategic acquisitions of, or investments in, other companies, and (iii) proceeds from dispositions of investments and businesses.
Net cash provided byused for investing activities was $439 million in 2002, as compared to net cash provided from investing activities of $2.5 billion in 2001 as compared to $4.1 billion inand net cash used for investing activities of $4.1 billion in 2000 and $1.02000. The $2.9 billion change in cash used for investing activities in 1999. For 20012002 compared to 2000,2001 is primarily due to a decrease of $4.0 billion in proceeds received from dispositions of investments and businesses, increasedpartially offset by $2.6 billion,a $714 million decrease in capital expenditures decreased by $2.8 billion and a $418 million decrease in spending on acquisitions and new investments decreased by $1.4 billion.investments.
Capital Expenditures: Capital expenditures were $607 million in 2002, compared to $1.3 billion in 2001 and $4.1 billion in 2000. Capital expenditures were $1.3 billion,down in all six of the Company's major business segments in 2002 compared to $4.1 billion and $2.9 billion in 2000 and 1999, respectively.2001. Although the Semiconductor Products segment continued(SPS) continues to comprise the largest portion of thesethe Company's capital expenditures, the amount spentSPS expenditures decreased 64% to $220 million in 2001 by SPS decreased2002, compared to $613 million from $2.4 billon in 2000. In 2002,2001. For the full year 2003, the Company expects capital expenditures to increase approximately 20% to $1.6be no greater than $1.0 billion.
Strategic Acquisitions and Investments: Cash consumed by the Company's acquisitionThe Company used cash for acquisitions and new investment activities declined during 2001of $94 million in 2002, compared to approximately $512 million compared toin 2001 and $1.9 billion in 2000. The largest components of the 2002 expenditures related to: (i) the acquisition of 4thpass Inc., a provider of software that enables wireless operators to manage and $632 million consumeddeliver applications and other mobile content over the air to mobile devices, by the Personal Communications segment, and (ii) the acquisition of certain network assets from Scana Communications, Inc. for use in 2000providing radio network services in South Carolina, by the Commercial, Government and 1999, respectively. InIndustrial Solutions segment. The 2001 cash expenditures were comprised primarily ofrelated to investments in Callahan Associates International L.L.C. by the Broadband Communications segment and the acquisition of the remaining 50% interest in Tohoku Semiconductor Corporation, which included thea $345 million assumption of $345 million in debt, by the Semiconductor Products segment.
Dispositions of Investments and Businesses: The Company received $4.1 billion incash proceeds from dispositions of investments and businesses of $96 million in 2001,2002, compared to $1.4 billion and $2.6 billion received in 2000 and 1999, respectively. The $4.1 billion in 2001 and $1.4 billion in 2000. The 2002 proceeds included: (i) $2.9 billionwere generated primarily from the Company's sale of its investmentsequity securities of other companies held in the Company's investment portfolio and from the sale of the Company's CodeLink™ bioarray business. The 2001 proceeds were primarily generated from the sale of: (i) the Company's interests in several cellular operating companies outside the U.S.;, (ii) $825 million from the sale of theCompany's former Integrated Information Systems Group;Group, and (iii) $342 million from the saleequity securities of securitiesother companies held for investment purposes and other assets.
Short-Term Investments: At December 31, 2002, the Company had $59 million in short-term investments (which are highly-liquid fixed-income investments with an original maturity greater than three months but less than one year), compared to $80 million of short-term investments at December 31, 2001.
In addition to available cash and cash equivalents, the Company views its available-for-sale securities as an additional source of liquidity. At December 31, 2001 and
MANAGEMENT'S DISCUSSION AND ANALYSIS OF FINANCIAL CONDITION AND RESULTS OF OPERATIONS F-13
December 31, 2000, the Company's available-for-sale securities had approximate fair market values of $2.0 billion and $4.7 billion, respectively. The majority of these securities represent investments in technology companies and, accordingly, the fair market values of these securities are subject to
F-12 MANAGEMENT'S DISCUSSION AND ANALYSIS OF FINANCIAL CONDITION AND RESULTS OF OPERATIONS
substantial price volatility. During 2001, these securities suffered a net unrealized decline of $1.9 billion. In particular, the value of the Company's investment in Nextel Communications, Inc. declined 55% in 2001, from $2.6 billion to $1.2 billion, and has subsequently declined an additional 44% to $669 million as of March 15, 2002. During the first quarter of 2002, the fair market value of the Company's investment in Nextel fell below the Company's average cost. Net unrealized gains on these securities were $556 million at December 31, 2001 compared to $2.5 billion at December 31, 2000. In addition, the realizable value of these securities is subject to market and other conditions. Additionally, inAt December 31, 2002, the Company's available-for-sale securities portfolio had an approximate fair market value of $1.6 billion, which represented a cost basis of $615 million and an unrealized gain of $954 million. At December 31, 2001, management determined thatthe Company's available-for-sale securities portfolio had an approximate fair market value of $2.0 billion, which represented a cost basis of $1.4 billion and an unrealized gain of $556 million. In 2002, the Company impaired $655 million of certain available-for-sale securities as the decline in the value of certain individual investmentsthese securities was determined to be other than temporary.
Nextel Ownership: In March 2003, the Company sold 25 million of its 108.2 million shares of common stock of Nextel Communications, Inc. ("Nextel") to a single investment bank for resale into the open market. The Company received $13.42 per Nextel share from the block sale, generating approximately $335 million in gross proceeds. The book value of the portfolio25 million shares that were sold was other-than-temporaryapproximately $80 million, resulting in a realized gain for the Company of approximately $255 million.
In March 2003, the Company also entered into three agreements with multiple investment banks to hedge up to 25 million of its remaining 83.2 million shares of Nextel common stock. The three agreements are to be settled over periods of three, four and thus recorded an impairment chargefive years, respectively. Under these agreements, the Company received no initial proceeds, but has retained the right to receive, at any time during the contract periods, the present value of $1.2 billion.the aggregate contract "floor" price. Pursuant to these agreements and exclusive of any present value discount, Motorola is entitled to receive aggregate proceeds of approximately $333 million. The precise number of shares of Nextel common stock that Motorola would deliver to satisfy the contracts is dependent upon the price of Nextel common stock on the various settlement dates. The maximum aggregate number of shares Motorola would be required to deliver under these agreements is 25 million and the minimum number of shares is 18.5 million. Alternatively, Motorola has the exclusive option to settle the contracts in cash. Motorola will retain all voting rights associated with the up to 25 million hedged Nextel shares. Although, pursuant to customary market practice, the covered shares are pledged to secure the hedge contracts.
Financing Activities
The most significant components of the Company's financing activities are: (i) net proceeds from (or repayment of) commercial paper and short-term borrowings, and (ii) net proceeds from (or repayment of) long-term debt securities. The Company also has available liquiditysecurities, (iii) the payment of dividends, and (iv) proceeds from the issuances of stock due to the exercise of stock warrants and employee stock options and purchases under its existing credit facilities.the employee stock purchase plan.
Net cash used for financing activities was $484 million in 2002, as compared to net cash used of $1.8 billion in 2001 as compared to $5.1 billion and $788 millionnet cash provided by financing activities for 2000 and 1999, respectively.of $5.1 billion in 2000. Cash was used for financing activities in 20012002 was primarily used to: (i) pay dividends, (ii) repay long-term debt and (iii) repurchase remarketing rights related to reduce outstanding commercial paper and short-term debt by $5.7 billion,the retirement of the Company's Puttable Reset Securities (PURS)sm, partially offset byby: (i) proceeds from the issuance of $4.0 billioncommon stock due to the exercise of new long-term debt.stock warrants and employee stock options, and (ii) purchases under the employee stock purchase plan.
At December 31, 2001,2002, the Company's outstanding short-term debt was $870 million,$1.6 billion, compared to $6.4 billion$870 million at December 31, 2000.2001. The increase in short-term debt during 2002 reflects a reclassification of the $825 million of PURS due February 1, 2011 from long-term debt to the current portion of long-term debt. The reclassification was made in the first quarter of 2002 because on February 1, 2003, and each anniversary thereof while the PURS were outstanding, the Company could have been required to redeem the PURS. In December 2002, the Company entered into an agreement with Goldman, Sachs & Co. ("Goldman") to repurchase the PURS from Goldman for $825 million on February 3, 2003. The Company paid Goldman $106 million to terminate Goldman's annual remarketing rights associated with the PURS. On February 3, 2003, the Company purchased the $825 million of PURS from Goldman with cash on hand.
At December 31, 2001,2002, the Company had $514$495 million of outstanding commercial paper.paper, compared to $514 million outstanding at December 31, 2001. The Company currently expects its outstanding commercial paper balances to average aroundapproximately $500 million throughout 2002.2003.
At December 31, 2002, the Company had long-term debt of $7.2 billion, compared to $8.4 billion of long-term debt at December 31, 2001. This reduction in long-term debt consists primarily of the reclassification of the $825 million of PURS discussed previously and the repurchase of $84 million face value of long-term debt previously issued by the Company through open market purchases.
In December 2002, through a series of open market purchases, the Company purchased approximately $48 million face value of its 5.22% debentures due October 1, 2097 and approximately $36 million face value of its 6.50% debentures due November 15, 2028. These long-term debt instruments were purchased at prices below face value and, accordingly, the Company recorded a net gain of approximately $8 million on the repurchase of the debt.
Given the Company's significant cash position, it may from time to time seek to opportunistically retire certain of its outstanding debt through open market cash purchases, privately-negotiated transactions or otherwise. Such repurchases, if any, will depend on prevailing market conditions, the Company's liquidity requirements, contractual restrictions and other factors.
MANAGEMENT'S DISCUSSION AND ANALYSIS OF FINANCIAL CONDITION AND RESULTS OF OPERATIONS F-13
Debt Ratings: Two independent credit rating agencies, Standard & Poor's ("S&P") and Moody's Investor Services ("Moody's"), assign ratings to the Company's short-term and long-term debt. S&P's current credit rating for the Company's senior unsecured non-credit-enhanced long-term debt is "BBB+""BBB" with a "negative"stable outlook" and Moody's rating is "A3" and on "credit watch for possible downgrade.""Baa2" with a "negative outlook". The current ratings for the Company's commercial paper are "A-2" by S&P and "P-2" by Moody's.
The most recent actionactions by these agencies waswere on December 19, 2001,June 14, 2002, when S&P revised its credit rating for the Company's senior unsecured non-credit enhanced long-term debt to "BBB" with a "stable outlook" from "BBB+" with a "negative outlook", and on June 25, 2002, when Moody's placedrevised its credit rating for the Company's "A3"senior unsecured non-credit enhanced long-term debt ratingto "Baa2" with a "negative outlook" from "A3" on "credit watch for a possible downgrade"watch". Both S&P and S&P maintained its "BBB+" long-term debt rating, but changed its outlook to negative. When a company's debt is on "credit watch for possible downgrade," it meansMoody's explicitly affirmed the rating agency has determined that a change to the company's credit rating may be appropriate. Typically, a rating agency will then closely monitor the company for a short period of time before making a final determination. In general, the Company has observed that when a company's credit rating is placed on "credit watch for possible downgrade", absent an improvement in circumstances, a downgrade to the company's credit ratings is likely to occur. In addition, the Company has observed that when a company is placed on "credit watch for possible downgrade," the debt markets typically react by treating that company (in terms of interest rates required for borrowing, available maturities forCompany's commercial paper etc.) as if a downgrade had already occurred. The Company's recent experienceratings of "A-2" and "P-2", respectively, on "credit watch" has been consistent with these observations. A "negative outlook" is a longer-term view of credit quality that incorporates trends or risks with less certain implications for credit quality. An outlook is not necessarily a precursor of a rating change or a credit watch listing.
those dates. At the beginning of 2001,2002, the Company's senior unsecured non-credit-enhanced long-term debt was rated "A+"BBB+" by S&P and "A-1""A3" by Moody's. Since that time the Company's rating on its senior unsecured non-credit-enhanced long-term debt has been lowered three times by S&P to the current rating of "BBB+" with a "negative outlook" and twice by Moody's to "A3" and on "credit watch for possible downgrade". The Company's short-term debt rating was lowered by both agencies once, from "A-1/P-1" to "A-2/P-2".
Despite these downgrades, theThe Company continues to have access to the commercial paper and long-term debt markets. However, the Company generally has had to pay a higher interest rate to borrow money. Also, themoney than it would have if its credit ratings were higher. The Company has issued more long-term debt andgreatly reduced the amount of its short-term debt, particularly the amount of commercial paper issued byoutstanding in comparison to historical levels. This reflects the Company. This was done becausefact that the market for commercial paper rated "A-2/"A-2 / P-2" is much smaller than that for "A-1/P-1" commercial paper rated "A-1 / P-1" and commercial paper or other short-term borrowings may be unavailable or of limited availability to participants in thisthe "A-2 / P-2" market from time-to-time or for extended periods.
The Company's debt rating isratings are considered "investment grade." If the Company's senior long-term debt were rated lower than "BBB-" by S&P or "Baa3" by Moody's (which would be a decline of at least threetwo levels from current ratings), the Company's long-term debt would no longer be considered investment grade."investment grade". If this were to happen,occur, the terms on which the Company could borrow money would become more onerous. In addition, if these debt ratings declinedwere to be lower than "BBB" by S&P or "Baa2" by Moody's (which would be a decline of at least two levelsone level from current ratings), the Company and its domestic subsidiaries would be obligated to provide the lenders in the Company's domestic revolving credit facilities with a pledge of,
F-14 MANAGEMENT'S DISCUSSION AND ANALYSIS OF FINANCIAL CONDITION AND RESULTS OF OPERATIONS
and security interest in, domestic inventories and receivables. This would convert these facilities into secured facilities from unsecured facilities. The Company would also have to pay higher fees related to these facilities. The Company has never borrowed under its domestic revolving credit facilities.
As further described under "Customer Financing Arrangements" below, for many years Motorolathe Company has utilized a receivables program to sell a broadly-diversified group of short-term receivables, through Motorola Receivables Corporation (MRC), to independent third parties on a non-recourse basis. Theparties. As of December 31, 2002, the MRC short-term receivables program providesprovided for up to $400 million of outstanding short-term receivables at any time. In February 2003, the MRC short-term receivables program was renewed and the level of allowable outstanding short-term receivables was increased to $425 million. There were approximately $240 million of short-term receivables outstanding under the MRC short-term receivables program at December 31, 2002, as compared to $465 million outstanding at December 31, 2001 (when the receivables program provided for up to $600 million of short-term receivables to be outstanding at any time. There were approximately $465 million of short-term receivables that have been sold to independent third parties outstanding at December 31, 2001.receivables). The obligation of the third parties to continue to purchase receivables under the MRC short-term receivables program could be terminated if Motorola'sthe Company's long-term debt was rated lower than "BBB""BB" by S&P or "Baa2""Ba2" by Moody's.Moody's (which would be a decline of four levels from current ratings). If the MRC short-term receivables program were terminated, Motorolathe Company would no longer be able to sell its short-term receivables in this manner, but it would not havebe required to repurchase previously-sold receivables.
Also, as further described under "Customer Financing Arrangements" below, Motorolathe Company has sold a limited number of long-term loans to an independent third party in prior years through Motorola Funding Corporation. TheNo finance receivables were sold under this program can be terminated if Motorola's long-term debt was rated lower than "BBB" by S&P or "Baa2" by Moody's. Ifduring 2002. Total finance receivables outstanding with the independent third party under this program at December 31, 2002 were terminated, Motorola would no longer be able$71 million, as compared to sell long-term loans in this manner, but it would not have to repurchase previously-sold loans.$166 million at December 31, 2001. In certain events, including if Motorola'sthe Company's long-term debt were rated lower than "BBB" by S&P or "Baa2" by Moody's Motorola(which would be a decline of one level from current ratings), the Company could be required to make additional funded deductible payments to the insurer in order to maintain the credit insurance coverage of these loans. These additional payments willwould not exceed $35 million in the aggregate.
Issuances of Securities,Lease Obligations and Credit Facilities and Lease Obligations: In the first quarter of 2001, the Company received aggregate net proceeds of $2.23 billion from the concurrent issuance and sale of $1.4 billion of 6.75% Notes due February 1, 2006 and $825 million of Puttable Reset Securities (PURS)sm due February 1, 2011. These proceeds were used to reduce short-term indebtedness and for general corporate purposes. Beginning on February 1, 2003 and on each anniversary thereof while the PURS are outstanding, the Company may be required to redeem the PURS. If the PURS are not redeemed they will be remarketed at the prevailing market rate for one-year notes.
At the end of the first quarter, the Company entered into a $2 billion multi-draw term loan facility with several lenders. The Company used the proceeds from this facility for general corporate purposes, including repayment of commercial paper indebtedness. The Company repaid this facility in the fourth quarter of 2001 with the proceeds of the sales of its investments in four cellular operating companies in northern Mexico and the sale of the Company's Integrated Information Systems Group and the facility was terminated.
In August 2001, holders of $197 million of the Company's outstanding $200 million of 8.4% of debentures due August 15, 2031, exercised their right to put the debentures back to the Company at par and these debentures were repaid.
In the fourth quarter of 2001, the Company sold an aggregate face principal amount of $600 million of 8.00% Notes due November 1, 2011 (the "Notes"). The net proceeds to the Company from the sale of the Notes were $593 million. The Company used the proceeds to reduce short-term indebtedness and for general corporate purposes. The Company also sold $1.2 billion of 7.00% Equity Security Units (the "Units"). The Units consist of: (i) purchase contracts under which (a) the holder will purchase shares of common stock of the Company, on November 16, 2004, and (b) the Company will pay contract adjustment payments at the annual rate of .50% of the $50 per Unit face amount, and (ii) 6.50% Senior Notes due November 16, 2007 that pay interest at the annual rate of 6.50% of the $50 per Unit face amount. The aggregate net proceeds of $1.76 billion to the Company from the sale of the Units and the Notes was used to reduce short-term indebtedness and for general corporate purposes.
The Company owns most of its major facilities, but does lease certain office, factory and warehouse space and land, andas well as data processing and other equipment under principally noncancelablenon-cancelable operating leases. Rental expense, net of sublease income, was $414$294 million in 2002, $417 million in 2001 and $378 million in 2000 and $346 million in 1999. At December 31, 2001, future minimum lease obligations, net of minimum sublease rentals, for the next five years and beyond are as follows: 2002 — $150 million; 2003 — $117 million; 2004 — $97 million; 2005 — $76 million; 2006 — $63 million; beyond — $90 million. These amounts are also included in the table immediately below.2000.
F-14 MANAGEMENT'S DISCUSSION AND ANALYSIS OF FINANCIAL CONDITION AND RESULTS OF OPERATIONS F-15
Summarized below are the Company's obligations and commitments to make future payments under debt obligations (assuming earliest possible exercise of put rights by holders) and lease agreements based on obligations at December 31, 2001.
Contractual Obligations
| | Payments Due by Period | ||||||||||||||
|---|---|---|---|---|---|---|---|---|---|---|---|---|---|---|---|
| (in millions) | Total | 2002 | 2003 — 2005 | 2006 | Thereafter | ||||||||||
| Debt Obligations | $ | 9,366 | $ | 870 | $ | 2,103 | $ | 1,400 | $ | 4,993 | |||||
| Operating Leases | 593 | 150 | 290 | 63 | 90 | ||||||||||
| Total Contractual Cash Obligations | $ | 9,959 | $ | 1,020 | $ | 2,393 | $ | 1,463 | $ | 5,083 | |||||
Summarized in the table below are the Company's obligations and commitments to make future payments under debt obligations (assuming earliest possible exercise of put rights by holders) and minimum lease payment obligations, net of minimum sublease income, as of December 31, 2002.
| | Payments Due by Period | ||||||||||||||||||||
|---|---|---|---|---|---|---|---|---|---|---|---|---|---|---|---|---|---|---|---|---|---|
| (in millions) | Total | 2003 | 2004 | 2005 | 2006 | 2007 | Thereafter | ||||||||||||||
| Debt Obligations | $ | 8,932 | $ | 1,629 | $ | 544 | $ | 402 | $ | 1,402 | $ | 1,503 | $ | 3,452 | |||||||
| Leases | 770 | 205 | 162 | 121 | 110 | 79 | 93 | ||||||||||||||
| Total Contractual Cash Obligations | $ | 9,702 | $ | 1,834 | $ | 706 | $ | 523 | $ | 1,512 | $ | 1,582 | $ | 3,545 | |||||||
The Company's ratio of net debt to net debt plus equity was 16.7% at December 31, 2002, compared to 18.4% at December 31, 2001 compared to 27.4% at December 31, 2000.2001. The decrease in the net debt to net debt plus equitythis ratio is due to an increase in cash and cash equivalents and a decrease in short-termtotal debt levels, partially offset by an increase in long-term debt levels and a reduction in stockholders' equity.
The Company expects that from time to time outstanding commercial paper balances may be replaced with short or long-term borrowings. Although the Company believes that it can continue to access the capital markets in 20022003 on acceptable terms and conditions, its flexibility with regard to long-term financing activity could be limited by: (i) the large amountCompany's current levels of outstanding long-term financing completed by the Company in late 2000 and during 2001debt, and (ii) the Company's credit ratings. In addition, many of the factors that affect the Company's ability to access the capital markets, such as the liquidity of the overall capital markets and the current state of the economy, in particular the telecommunications industry, are outside of the Company's control. There can be no assurances that the Company will continue to have access to the capital markets on favorable terms.
At December 31, 2001,2002, the Company's total domestic and non-U.S. credit facilities totaled $4.7$4.2 billion, of which $732$338 million was considered utilized. These facilities are principally comprised of: (i) a $1.5 billion$900 million one-year revolving domestic credit facility (maturing in May 2003) which is not utilized, (ii) a $1.0 billion five-year$900 million three-year revolving domestic credit facility (maturing in May 2005) which is not utilized, and (iii) $2.2$2.4 billion of non-U.S. credit facilities (of which $732$338 million was considered utilized at December 31, 2001)2002). The Company has never borrowed under the one-year or five-year revolving credit facilities. Unused availability under the existing credit facilities, together with available cash and cash equivalents and other sources of liquidity, are generally available to support outstanding commercial paper, which was $514$495 million at December 31, 2001. However, these agreements contain various conditions, covenants and representations with which2002. In order to borrow funds under the domestic revolving credit facilities, the Company must be in compliance with various conditions, covenants and representations contained in orderthe agreements. Important terms of the revolving domestic credit agreements include a springing contingent lien and covenants relating to borrow fundsnet interest coverage and have this liquidity.
The one-total debt-to-equity capitalization ratios. In the case of the contingent springing lien, if the Company's corporate credit ratings were to be lower than "BBB" by S&P or "Baa2" by Moody's (which would be a decline of one level from the current corporate credit ratings of "BBB" and five-year"Baa2"), the Company and its domestic subsidiaries would be obligated to provide the lenders in the Company's domestic revolving credit facilities are scheduled to terminatewith a pledge of, and security interest in, Julydomestic inventories and September of 2002, respectively. While thereceivables. The Company plans to obtain new domestic credit facilities, the Company anticipates thatwas in compliance with the terms on which it can obtain this new financing will be less favorable thanof the current facilities because of both the Company's recent financial performance and current market conditions.credit agreements at December 31, 2002. The Company has never borrowed under its domestic revolving credit facilities.
Return on average invested capital, based on performance of the four preceding quarters ending with December 31, 2002 and 2001, and December 31, 2000, were (18.0)was (15.9)%, and 6.3%(18.0)%, respectively. The Company's current ratio was 1.75 at December 31, 2002, as compared to 1.77 at December 31, 2001, compared2001.
The Company believes that it has adequate internal and external resources available to 1.22 at December 31, 2000.
Based uponfund expected working capital and capital expenditure requirements for the next twelve months as supported by the level of cash and cash equivalents in the U.S., the ability to repatriate cash and cash equivalents from foreign jurisdictions, the ability to borrow under its existing or future credit facilities, the ability to issue commercial paper, access to the short-term and long-term debt markets, and proceeds from sales of available-for-sale securities and other investments, the Company believes that it has adequate internal and external resources available to fund expected working capital and capital expenditure requirements for the next twelve months.investments.
Customer Financing Arrangements
Outstanding Commitments: Certain purchasers of the Company's infrastructure equipment seekcontinue to obtainrequire suppliers to provide financing from suppliers in connection with sizeable equipment purchases. The requested financingFinancing may include all or a portion of the equipment purchase price as well as working capital.
Outstanding Commitments: During 2001 and continuing intoof the equipment. At December 31, 2002, the Company has substantially diminished its commitments to provide customer financing. At December 31, 2001, the Company had aggregate outstanding unfunded commitments to extend credit to customersthird-parties of approximately $162$175 million, as compared to outstanding unfunded commitments of $494$162 million at December 31, 2000.2001. During 2001,2002, the Company made loans to customers of $67 million, as compared to loans to customers of $434 million.million during 2001.
Outstanding Finance Receivables: During the "telecom boom" that peaked in late 2000, numerous wireless equipment makers, including the Company, made loans to customers, some of which were very large. At December 31, 2001 and December 31, 2000 theThe Company had net finance receivables of $467 million at December 31, 2002, compared to $1.1 billion at December 31, 2001 and $2.7 billion respectivelyat December 31, 2000 (net of allowances for losses of $2.3 billion at December 31, 2002, $1.6 billion at December 31, 2001 and $239 million at December 31, 2000). These finance receivables are interest-bearing,interest bearing, with rates ranging
F-16 MANAGEMENT'S DISCUSSION AND ANALYSIS OF FINANCIAL CONDITION AND RESULTS OF OPERATIONS F-15
rates ranging from 5%3% to 15%. Interest income on impaired finance receivables is recognized using the finance method for fixed rate loans and the interest method for variable market rate loans. Under this method, the accrual of interest income is suspended at the earlier of the time at which collection becomes doubtful or the receivable becomes 90 days delinquent.only when payments are received. Total interest income recognized for 2001, 2000 and 1999 was $131 million, $234 million and $145 million, respectively. The allowance for losses on finance receivables was $1.65 billion, $239$28 million in 2002, compared to $131 million in 2001 and $292$234 million asin 2000.
Telsim Loan: During the second quarter of December 31, 2001, 2000 and 1999, respectively. During 2001 a $1.37 billion2002, an additional $526 million charge was recorded increasing to $1.51increase to $2 billion the allowance for losses relating to one customer, Telsim, in Turkey (the "Telsim Loan"). As of December 31, 2001 and 2000, the net receivableJune 29, 2002, all receivables from Telsim was $531 million and $1.69 billion, respectively.
Telsim Loan: During 2001, a $1.37 billion charge was recorded to increase the allowance for losses relating to one customer, Telsim, a wireless telephone operator in Turkey (the "Telsim Loan"). This increased the total allowance for losses relating to the Telsim Loan to $1.51 billion. As of December 31, 2001, the net receivable from Telsim was $531 million,were fully reserved, compared to a net receivable of $1.69$531 million at December 31, 2001 and a net receivable of $1.7 billion at December 31, 2000. Regardless of the reserves already taken, Motorolathe Company will continue to pursue remedies to collect the over $2 billion owed to Motorolathe Company under the Telsim Loan.
On April 30, 2001, $728 million of the Telsim Loan became due under formerly restructured loans, but was not paid. This rendered theThe entire Telsim Loan has been in default. Following the cure period, the Company notified Telsim that it had accelerated payment of all amounts due under the loan, including interest. As security for the Telsim Loan, 66% of the stock of Telsim was pledged to Motorola. In addition, the Company has other creditor remedies granted by law. In direct breach of contractual agreements, Telsim issued additional shares and diluted the ownership percentage of Telsim represented by shares previously pledged to Motorola from 66% to 22%.
default since April 2001. Thus far, the Uzans (the family that controls Telsim) and Telsim hashave been uncooperative in restructuring the loan or in entering into a transaction with third-party investors to either sell or bring new equity into Telsim. The Uzans have also violated court orders in several jurisdictions.
In January 2002, the Company, together with another Telsim creditor,Nokia, filed suit against the owners of Telsim and certain related parties in the United States Southern District of New York (the "District Court") for injunctive relief and damages. As further described under "Item 3: Legal Proceedings" in the Company's Annual Report on Form 10-K for the year ended December 31, 2002, this suit, as well as other legal proceedings relating to reclaim all amounts owed, including damages. The suit alleges 13 separate counts of wrongdoing, including four counts of criminal activitythe Telsim Loan in violationnumerous jurisdictions, is ongoing.
Although the Company will continue to vigorously pursue its recovery efforts, the Company currently believes that the litigation and collection process will be very lengthy in light of the Racketeer Influenced and Corrupt Organizations Act, commonly known as "RICO".Uzans' repeated decisions to violate court orders. As a result, the Company fully reserved the remaining carrying value of the Telsim Loan in the second quarter of 2002.
NII Holdings Loan: NII Holdings, Inc. ("NII") is a subsidiaryan affiliate of Nextel Communications, Inc. with international wireless operations and investments. At December 31, 2002 and 2001, the Company had total loans due from NII (the "NII Loans") of $275 million and $382 million, respectively, and allowances for losses relating to the NII Loans of $6 million and $34 million. In early February 2002, NII announced that it failed to make a scheduled interest payment on certain of its debt and further stated that it did not plan to make any future principal or interest payments on other loans, including the NII Loans. Motorola received a $2.5 million, loan repayment in February from escrow accounts maintained by NII as collateral for certain of the NII Loans.respectively. The administrative agent for the applicable loans exercised the unilateral right to draw the funds from these escrow accounts. Based on NII's statement that future payments will not be paid, the Company has ceased accruing interest on the outstanding amounts of the NII Loans.Loans in January 2002.
In May 2002, NII filed for bankruptcy court protection. NII's failureChapter 11 Reorganization Plan (the "Plan") was confirmed and NII emerged from bankruptcy on November 12, 2002. In connection with the bankruptcy proceedings, $56.7 million of the $332 million owed to make the scheduled interest payments resulted in cross defaults under the NII Loans and other loans. Since its announcement in early February, NII has entered into discussions with various creditors, including the Company regarding restructuringby NII was repaid in exchange for the Company's commitment to relend a like amount under certain conditions. In addition, with regard to the $275 million still owed to the Company by NII, the Company added to its debt.
The Company has various forms ofpre-bankruptcy collateral to secure one or more of the outstanding NII Loans, including $57 million of escrowed cash,position (which included equipment liens and shares of certain operating and holding companies and equipment liens. Although the Company is hopeful that NII will be able to restructure its obligations and pay the Company the amounts it is owed, the Company will exercise its rights with respect to thesecompanies) by obtaining security interests if necessaryin all tangible assets of NII's operations in Mexico, Peru and Argentina. The Company recognizes interest on the outstanding NII Loans only when cash is received.
Prior to recover the amounts it is owed. There is no guarantee that NII will be ableNII's bankruptcy, Motorola also participated in a Chase-led syndicated loan totaling $150 million to restructure its debt obligations or repay the Company the amounts currently owed either in or outan Argentinean subsidiary of a bankruptcy proceeding. If NII files for bankruptcy, the automatic stay provisionsNII. As part of the US bankruptcy code will preventPlan, Motorola received approximately $1.7 million of the Company from exercising its rights$33.5 million remaining balance on the $50 million it originally loaned, sharing pro rata with respect to its collateral unless it receives permission from the bankruptcy court. There is no assurance when, or if, permission would be granted by a bankruptcy court.other banks in the $5 million cash recovery being paid on this loan. In addition, Motorola received .667% of the fully diluted shares of NII in settlement of this loan.
Based on itsconfirmation of the Plan and the Company's security interests, the Company believes that it has adequately provided for additional losses, if any, relating to the NII Loans based on the information available to the Company at this time.
Dolphin Telecom Loans: In July 2001, Dolphin Telecom plc filed for protection from creditors with a related filing of insolvency proceedings for Dolphin Telecom (Deutschland) GmbH filed shortly thereafter. At the time of this filing, receivables due from Dolphin Telecom (Deutschland) GmbH were approximately $100 million, the entire amount of which is reserved for as an allowance for losses.
The Company continues to pursue with the courts various alternatives for realizing value for the Dolphin receivables. Such alternatives are likely to include the sale of certain assets or interests in the underlying business to permit a reorganization.
Other Impaired Finance Receivables: OtherAt December 31, 2002, other impaired finance receivables total $55totaled $189 million and arewere due from nineeight customers, with the largest individual balance due being $28 million.$115 million from Dolphin GmbH. Total allowances for losses for these receivables are $22were $171 million, resulting in a net amount dueoutstanding of $33$18 million.
MANAGEMENT'S DISCUSSION AND ANALYSIS OF FINANCIAL CONDITION AND RESULTS OF OPERATIONS F-17
Guarantees of Third-Party Debt: In addition to providing direct financing to certain equipment customers, as discussed above, the Company also assists customers in obtaining financing directly from banks and other sources to fund equipment purchases and working capital. The amount of loans from third parties for which Motorolathe Company has committed to provide financial guarantees totaled $275$50 million at December 31, 2001,2002, as compared to a commitment to provide financial guarantees of $651$205 million at December 31, 2000.2001. Customer borrowings outstanding under these guaranteed third-party loan arrangements were $184$50 million at December 31, 2001,2002, as compared to $524$114 million at December 31, 2000. Since January 1, 2001,2001. During 2002, the Company has beenwas required to make payments of $27$50 million in satisfaction of its guarantees of third-party debt. In addition, the Company has guaranteed a lease termination penalty totaling $85debt, as compared to payments of $27 million which is payable through 2008.during 2001.
The Company evaluates its contingent obligations under these financial guarantees by assessing the customer's financial status, account activity and credit risk, as well as the current economic conditions and historical experience. The $275$50 million of guarantees discussed above is comprised of one customerguarantees for two customers in the amountamounts of $88$28 million with the remaining balance represented by customers with individual guarantees of less than $25and $22 million. Management's best estimate of probable losses of unrecoverable amounts, should these guarantees be called, was $74 million and $25 million at December 31, 2001 and 2000, respectively.2002, as compared to $56 million at December 31, 2001.
F-16 MANAGEMENT'S DISCUSSION AND ANALYSIS OF FINANCIAL CONDITION AND RESULTS OF OPERATIONS
Sales of Receivables and Loans: From time to time, the Company sells short-term receivables and long-term loans to unrelated third parties. To qualifyparties in transactions that qualifiy as a "true-sale""true-sales". Certain of these receivables are sold through separate legal entities, with Motorola Receivables Corporation ("MRC") selling short-term receivables and Motorola Funding Corporation ("MFC") selling long-term receivables. TheMRC and MFC are special purpose entities and the financial results for these legal entitiesMRC and MFC are fully consolidated in Motorola'sthe Company's financial statements. These receivables funding programs are administered through special purpose entities. Under FASB Interpretation No. 46, "Consolidation of Variable Interest Entities", the Company does not believe it will be required to consolidate those entities.
Short-termAs of December 31, 2002, the MRC short-term receivables areprogram provided for up to $400 million of short-term receivables to be outstanding with third parties at any time. In February 2003, the MRC short-term receivables program was renewed and the level of allowable outstanding short-term receivables was increased to $425 million. A total of $1.0 billion of receivables were sold on a non-recourse basis. Thethrough the MRC short-term program providesin 2002, as compared to $1.6 billion in 2001 and $1.4 billion in 2000. At December 31, 2002, there were approximately $240 million of short-term receivables outstanding under the MRC short-term receivables program, as compared to $465 million at December 31, 2001 (when the receivables program provided for up to $600 million of receivables to be outstanding at any time. The short-term program sold a total of $1.59 billion, $1.37 billion and $1.13 billion in 2001, 2000 and 1999, respectively. At December 31, 2001, there were approximately $465 million ofreceivables). Under the MRC short-term receivables outstanding under this program. Under this program, 90% of the value of the sold receivables sold is covered by credit insurance and the receivables are sold with a 20% holdback to coverobtained from independent insurance companies. The credit exposure on the remaining 10% of exposure ofis covered by a retained interest in the independentsold receivables.
In addition to the MRC short-term receivables program, the Company also sells other short-term receivables directly to third parties. Total short-term receivables sold by the Company (including those sold directly to third parties and credits, overcharges, rebates or other reductionsthose sold through the MRC short-term receivables program) were $2.9 billion in 2002, compared to $4.6 billion in 2001 and $3.8 billion in 2000. At December 31, 2002, a total of $802 million of short-term receivables were outstanding, receivables. Obligations arising from transactions fees or other costs associated withas compared to $1.7 billion at December 31, 2001. The Company's total credit exposure to outstanding short-term receivables was $40 million at December 31, 2002, compared to $70 million at December 31, 2001. At December 31, 2002, the Company had reserves of $19 million recorded for potential losses pursuant to this program are included in MRC's financial results.credit exposure, compared to reserves of $18 million at December 31, 2001.
The Company has sold a limited number of long-term loansreceivables to aan independent third party through MFC. In connection with the sale of long-term receivables, the Company retains obligations for the servicing, administering and collection of receivables sold. TheNo such receivables sold in this program are backed by $500 million of credit insurance, the proceeds of which have been assigned to the purchaser of the loans. The Company has first-loss risk of $100 million and has funded $65 million of this first loss with the insurers as a refundable insurance deposit. In certain events, including if Motorola's long-term debt were rated lower than BBB by S&P or Baa2 by Moody's, Motorola could be required to make additional funded deductible payments in order to maintain the insurance coverage for these loans. These additional payments will not exceed $35 million in the aggregate.
Total finance receivables sold under this program are $284during 2002. At December 31, 2002, the total finance receivables outstanding under this program were $71 million, withcompared to $166 million outstanding at December 31, 2001. The Company has provided an allowance for first loss of $14 million at December 31, 2002, as compared to $60 million at December 31, 2001.
The Company has no special purpose entities whose results are not fully consolidated in the Company's financial statements.
Next Level Communications, Inc.:
At December 31, 2001,2002, the Company had approximatelyand General Instrument Corporation, a 75%, controlling ownership interest inwholly-owned subsidiary of the Company, owned 74% of the outstanding common stock of Next Level Communications, Inc. (Next Level), a publicly-traded subsidiary, which is consolidated in Motorola's financial statements. In addition, the Company owns all of the preferred stock of Next Level, which is convertible into common stock, and warrants to purchase common stock at various prices over various periods. Assuming the conversion of all preferred stock and the exercise of all warrants, Motorola beneficially owns approximately 90% of Next Level's common stock. Effective in the fourth quarter of 2001, Motorolathe Company began to include in its consolidated results the minority interest share of Next Level's operating losses as a result of Next Level's cumulative net deficit equity position.
In other words, 100%January 2003, the Company initiated a tender offer for the remaining outstanding publicly-held shares of Next Level's financial results are consolidated in Motorola's financial statements.
Motorola began financing Next Level's operations in 2001. As of December 31, 2001 Motorola had intercompany financingsLevel that it does not own. The tender offer is still pending and is scheduled to Next Level of $112 million. Subsequent to December 31, 2001, Motorola made a $30 million investment in Next Level preferred stock. In conjunction with these financings to Next Level, Motorola has also received warrants. If the preferred stock were converted and the warrants were exercised it would increase Motorola's ownership to 81%.
The repayment of these intercompany financings is dependent upon Next Level generating positive cash flow or securing additional funding from sources outside of Motorola. If these events do not occur, Motorola may need to provide an allowance for some or all of these outstanding financings that are not collectible.expire on April 11, 2003.
Iridium Program
On November 20, 2000, the United States Bankruptcy Court for the Southern District of New York issued an Order that approved the bid of Iridium Satellite LLC ("New Iridium") for the assets of Iridium LLC and its operating subsidiaries (collectively "Old Iridium"). The Bankruptcy Order provided, among other things, that all obligations of Motorola and its subsidiaries and affiliates under all executory contracts and leases with Old Iridium relating to the
F-18 MANAGEMENT'S DISCUSSION AND ANALYSIS OF FINANCIAL CONDITION AND RESULTS OF OPERATIONS
Iridium system would, upon completion of the asset sale, be deemed terminated and, to the extent executory, be deemed rejected. Claims against Motorola by Old Iridium and others with respect to certain credit agreements and related matters were not discharged. New Iridium completed the acquisition of the operating assets of Old Iridium, including the satellite constellation, terrestrial network, and real and intellectual property of Old Iridium, on December 12, 2000. At the same time, Motorola entered into a contract with New Iridium to provide transition services pending the transfer of operations and maintenance in full to the Boeing Company. The Company also contracted with New Iridium to manufacture subscriber units and up to seven Iridium satellites. The Company does not anticipate
As further described under "Item 3: Legal Proceedings" in the contract with New Iridium will result in significant sales or earnings toCompany's Annual Report on Form 10-K for the Company. As a result of the acquisition by New Iridium, the Company reevaluated its commitments, risks and exposures to the Iridium program, including the new contracts with New Iridium.
The Company recorded $365 million and $2.1 billion of charges in 2001 and 1999, respectively, related to the Iridium program. There were no charges recorded by the Company in 2000. Motorola's reserves related to the Iridium program as ofyear ended December 31, 2001 and 2000 were $605 million and $272 million, respectively, and are included in accrued liabilities in the consolidated balance sheets. The balance at December 31, 2001 includes: (a) $365 million associated with an unfavorable ruling against the Company in 2001 in a case filed by2002, the Chase Manhattan Bank, related to a guarantee of a credit agreementas agent for Iridium LLC, and (b) $240 million related to: (i) additional cost of satellites to be built for New Iridium; (ii) termination costs related to subcontractors, and (iii) other costs to wind down Motorola's operations related to the Iridium program.
At December 31, 2000, Motorola had reserves related to the Iridium program of $272 million. In 2001, the Company utilized $32 million of the reserve for costs associated with the wind-down of Iridium operations and the costs of transitioning the operation of the satellite constellation system to the Boeing Company. The remaining $605 million of reserves as of December 31, 2001, will require future cash payments throughout 2002. These reserves are believed by management to be sufficient to cover Motorola's current exposures related to the Iridium program. These reserves do not include additional special charges that may arise as a result of litigation related to the Iridium program.
The Chase Manhattan Bank has filed three lawsuits against the Company with respect tolenders under Old Iridium's $800 million Senior Secured Credit Agreement. On June 9, 2000,Agreement, filed four lawsuits against Motorola. In March 2003, the Company reached a settlement agreement with Chase, filed a complaint in the Supreme Courtpursuant to which all four of the State of New York, New York County (which was subsequently removedcases, including Motorola's counterclaim, were dismissed with prejudice. Under the settlement agreement, Motorola
MANAGEMENT'S DISCUSSION AND ANALYSIS OF FINANCIAL CONDITION AND RESULTS OF OPERATIONS F-17
released to federal district court in New York), demanding that the Company provide a $300Chase its claim to $371 million guarantee that was required under certain circumstancespreviously paid into an escrow account in April 2002 and subject to certain conditions. The Company asserted that the conditions had not been met and that Chase was not entitled to demand the guarantee. Following a bench trial, in early 2002, the court entered an order granting judgment to Chase and ordering the Company to pay Chase $300 million plus interest and attorneys' fees. That ruling is subject to appeal at the conclusion of other proceedings in the case. On June 9, 2000, Chase also filed a complaint in the U.S. District Court in the District of Delaware demanding that the Company and other investors in Old Iridium pay their capital call requirements under Old Iridium's LLC Agreement, plus interest and legal fees. In Motorola's case, this could requiremade an additional equity investmentpayment of up to approximately $50$12 million. No trial date has been scheduled in the capital call lawsuit. Finally, on October 1, 2001, Chase and 17 other lenders of Old Iridium (or their successors) filed a complaint against Motorola in the Supreme Court of New York alleging that they were fraudulently induced by Motorola and Old Iridium to enter into the Senior Secured Credit Agreement discussed above. The plaintiffs seek recovery of the unpaid portion of the loans. Discovery in this lawsuit has not yet begun.
A committee of unsecured creditors (the "Creditors Committee") of Old Iridium has,was, over objections by Motorola, been granted leave by the Bankruptcy Court to file a complaint on Old Iridium's behalf against Motorola. In March 2001, the Bankruptcy Court approved a settlement between the Creditors Committee and Old Iridium's secured creditors that provides for the creation of a litigation fund to be used in pursuit of such proposedthe claims against Motorola. Motorola has appealedMotorola's appeal of this order.order is pending. On July 19, 2001, the Creditors Committee filed aits complaint against Motorola in Bankruptcy Court on behalf of Old Iridium's debtors and estates,In re Iridium Operating LLC, et al. v. Motorola, seeking in excess of $4 billion in damages. Discovery in this case is underway.
Motorola has been named as one of several defendants in putative class action securities lawsuits pending in the District of Columbia arising out of alleged misrepresentations or omissions regarding the Iridium satellite communications business. The plaintiffs seek an unspecified amount of damages. On March 15, 2001, the federal district court consolidated the various securities cases underFreeland v. Iridium World Communications, Inc., et al., originally filed on April 22, 1999. Motorola moved to dismiss the plaintiffs' complaint on July 15, 2002, and that motion has not yet been decided. Plaintiffs have filed a motion for partial summary judgment, which is also pending.
In addition, Motorola was named as a defendant inAndrews, et al. v. Iridium World Communications, LTD, et al., filed in the Superior Court of California (San Diego), by 42 plaintiff purchasers of Iridium securities who alleged violations of California securities laws. The parties reached a settlement agreement in December 2002 which is proceeding to finalization.
The Iridium India gateway investors (IITL) have filed a suit against Motorola, and certain current and former Motorola officers, in an India court under the India Penal Code claiming cheating and conspiracy in connection with investments in Old Iridium and the purchase of gateway equipment. Under Indian law if IITL were successful in the suit, IITL could recover compensation of the alleged financial losses. An unfavorable outcomeIn September 2002, IITL also filed a civil suit in India against Motorola and Iridium LLC alleging fraud and misrepresentation in inducing IITL to invest in Iridium LLC and to purchase and operate an Iridium gateway in India. IITL claims in excess of one or more of these cases could have a material adverse effect on Motorola's financial position, liquidity or results of operations.$200 million in damages, plus interest.
Creditors and other stakeholders in Old Iridium may seek to bring various other claims against Motorola. A number
The Company recorded charges (income) relating to the Iridium program of purported class action$(63) million in 2002, and $365 million in 2001. There were no charges recorded by the Company in 2000. The income recognized in 2002 was primarily for the reduction in vendor termination claims and the refund of previously-incurred costs. The $365 million charge in 2001 related to an unfavorable ruling against the Company in a case filed by The Chase Manhattan Bank related to a guarantee of a credit agreement for Iridium LLC. As described above, the Company released its claim to the $371 million paid in connection with this ruling as part of its March 2003 settlement agreement with Chase.
The Company had reserves related to the Iridium program of $152 million at December 31, 2002, compared to $605 million at December 31, 2001. These reserves are included in Accrued Liabilities in the consolidated balance sheets. The reduction in the reserve balance is comprised of $432 million in cash payments and $21 million of non-cash items. The cash payments are comprised of the $371 million funding guarantee payment made into an escrow account and $61 million of other lawsuits alleging securities law violationspayments, primarily related to transition services obligations and the settlement of vendor termination claims. The non-cash items primarily relate to the reduction in vendor termination claims for claims settled at amounts less than originally estimated. In addition to the amounts disclosed above, Motorola received cash from certain vendors for the refund of previously-incurred Iridium costs which were included as income.
The reserve balance at December 31, 2002 of $152 million relates primarily to costs for the wind-down and transition of Motorola's operations to New Iridium and the disputes with Chase described above. The remaining reserves are expected to require future cash payments, primarily in 2003.
These reserves are believed by management to be sufficient to cover Motorola's current exposures related to the Iridium program. However, these reserves do not include additional charges that may arise as a result of litigation related to the Iridium program. While the still pending cases are in very preliminary stages and the outcomes are not predictable, an unfavorable outcome of one or more of these cases could have been filed naming Old Iridium, certain current and former officersa material adverse effect on the Company's consolidated financial position, liquidity or results of Old Iridium, other entities and Motorola as defendants.operations.
Segment Information
The following commentary should be read in conjunction with the 20012002 financial results of each reporting segment as detailed in Note 9,10, "Information by Segment and Geographic Region", of the Company's consolidated financial statements. GAAP
Orders, net sales, and operating results for the Company's major operations for 2002, 2001 as well as adjustments made to GAAP
MANAGEMENT'S DISCUSSION AND ANALYSIS OF FINANCIAL CONDITION AND RESULTS OF OPERATIONS F-19
results to exclude the impact of businesses sold and the impact of special items,2000 are discussedpresented below. During 2001, the Company sold its Integrated Information Systems Group (IISG), the Company's defense and government electronics business, and the Multiservice Networks Division, a provider of end-to-end managed network solutions. Additionally, in the first quarter of 2000 the Company sold its electronic ballast business.
Special items include employee severance costs, fixed asset impairments, litigation-related charges, investment impairments, goodwill/intangible asset impairments, in-process research and development charges, goodwill amortization, other unusual charges and gains on sales of investments and businesses.
The orderOrder information as of any particular date may not be an accurate indicator of future results, as orders are subject to revision or cancellation to reflect changes in customer needs.
F-18 MANAGEMENT'S DISCUSSION AND ANALYSIS OF FINANCIAL CONDITION AND RESULTS OF OPERATIONS
Personal Communications Segment
| | Years ended December 31 | ||||||||||
|---|---|---|---|---|---|---|---|---|---|---|---|
| ($ in millions) | 2001 | 2000 | 1999 | ||||||||
| Orders | $ | 10,869 | $ | 12,514 | $ | 13,694 | |||||
| % change from prior year | -13% | -9% | 29% | ||||||||
| Segment sales | $ | 10,448 | $ | 13,267 | $ | 11,932 | |||||
| % change from prior year | -21% | 11% | 18% | ||||||||
| Earnings (loss) before income taxes | $ | (1,797 | ) | $ | (328 | ) | $ | 608 | |||
| % change from prior year | -448% | -154% | 263% | ||||||||
| Special items: income (charge) | |||||||||||
| Reorganization of businesses | $ | (969 | ) | $ | (838 | ) | $ | 112 | |||
| Telsim receivable charge | (285 | ) | — | — | |||||||
| Investment impairment | (102 | ) | — | — | |||||||
| Amortization of goodwill | (13 | ) | (19 | ) | (17 | ) | |||||
| In-process research & development | — | — | (7 | ) | |||||||
| Gain on sale of investments/businesses | 7 | 68 | 10 | ||||||||
| Iridium related | — | — | (97 | ) | |||||||
| Net special items | $ | (1,362 | ) | $ | (789 | ) | $ | 1 | |||
| Earnings (loss) before income taxes, excluding special items | $ | (435 | ) | $ | 461 | $ | 607 | ||||
| % change from prior year | -194% | -24% | 473% | ||||||||
The Personal Communications segment (PCS) primarily designs, manufactures, sells and services wireless subscriber equipment, including wireless handsets iDEN® digital phones, and personal two-way radios, with related software and accessory products. Products are marketed worldwide through carriers, distributors, dealers, retailers,In 2002, PCS net sales represented 41% of the Company's consolidated net sales, compared to 35% in both 2001 and in certain markets, through licensees.2000.
| | Years Ended December 31 | Percent Change | |||||||||||
|---|---|---|---|---|---|---|---|---|---|---|---|---|---|
| (Dollars in millions) | 2002 | 2001 | 2000 | 2002 — 2001 | 2001 — 2000 | ||||||||
| Orders | $ | 9,708 | $ | 10,869 | $ | 12,514 | (11)% | (13)% | |||||
| Segment net sales | 10,847 | 10,436 | 13,246 | 4% | (21)% | ||||||||
| Operating earnings (loss) | 503 | (1,585 | ) | (332 | ) | *** | *** | ||||||
In 2001,2002, segment net sales decreased 21%increased 4% to $10.8 billion, compared to $10.4 billion and ordersin 2001. Orders declined 13%11% to $9.7 billion, compared to $10.9 billion. Segment salesbillion in 2001. Orders declined primarily due to PCS's efforts to assist their customers in implementing an improved shorter-cycle ordering process which enabled PCS's customers to reduce inventory lead-times, inventory levels and order backlog. As a result, the segment's backlog decreased to $1.1 billion at December 31, 2002, compared to $2.2 billion at December 31, 2001. The backlog amount reported for 2001 reflects a decrease of $0.3 billion from the previously-reported figure, which reflects a revision to the realizable dollar value of the handset units in backlog. The number of handset units in backlog at December 31, 2001 was not adjusted.
For the full year 2002, total industry handset unit shipments (also referred to as industry "sell-in") were approximately 400 million units, as compared to total industry sell-in of approximately 375 million units in 2001. Total industry handset units sold to end customers (also referred to as industry "sell-through") were approximately 400 million units in both 2002 and 2001. PCS continued to have the second-largest worldwide market share for wireless handsets. Market share for the segment was estimated to be 17.5% for the full year 2002, as compared to 16.6% for the full year 2001. Segment unit shipments were 70.2 million in 2002, up 12% from 62.5 million units in 2001. The segment's average selling prices and unit sales for wireless handsets, partially offset by increased sales of iDEN digital phones. On a geographicprice (ASP) was down 5% on an annual basis orders were down in all regions and sales were down significantly in Europe and down in all other regions. In 2001, average selling prices decreased by 13%. The decrease in average selling prices was2002, primarily due to a mix shift in demandunits toward lower price handsets in Latin America and Asia. The decline in ASP is reflective of historical reductions in selling prices, although the reduction in 2002 was less than historical averages. Over the last 5 years, the segment's ASPs have declined an average of 10% to lower-priced wireless handsets.15% per year.
In addition, the segment completed its plans to discontinue sales of paging products in 2002. Sales of paging products had been rapidly declining in recent years, and the segment concluded that they no longer complemented its product portfolio. Sales from paging products were $176 million in 2002 and $402 million in 2001.
On a geographic basis, unit shipments in 2002, compared to 2001, were up 22% in the Americas, up 13% in Asia and down 6% in Europe. Sales were up 15% in the Americas, down 1% in Asia and down 7% in Europe. Orders were up 19% in the Americas, down 12% in Europe and down 44% in Asia.
PCS's primary technologies are: (i) Global System for Mobile Communications (GSM), (ii) Code Division Multiple Access (CDMA), (iii) Time Division Multiple Access (TDMA), and (iv) iDEN® (integrated digital enhanced network). Unit shipments forin 2002, compared to 2001, were up 69% in TDMA, up 23% in CDMA, up 7% in GSM and up 5% in iDEN. Sales were up 56% in TDMA, up 18% in CDMA, up 4% in iDEN and down 9%4% in GSM.
A few customers represent a significant portion of PCS's sales. Purchases of iDEN® products by Nextel Communications, Inc. and its affiliates comprise approximately 15% of PCS's sales. In addition, approximately 19% of PCS's sales are to the China market and are primarily used on mobile systems operated by China Mobile and China Unicom, the two largest wireless operators in China.
The segment's operating earnings in 2002 were $503 million, compared to 2000an operating loss of $1.6 billion in 2001. The improvement in operating results was primarily related to: (i) a decrease in reorganization of business and other charges, (ii) increased sales, (iii) decreased manufacturing expenses due to lower overallbenefits from cost-reduction activities and supply-chain efficiencies, (iv) a decrease in R&D costs, and (v) a decrease in SG&A costs, primarily relating to administrative costs. The Company records royalty income as an offset to SG&A expenses. Royalty income for the segment was $327 million in 2002 and $332 million in 2001.
During 2002, PCS continued executing on the major cost-reduction actions started in late 2000 to improve its cost structure and competitiveness. PCS introduced several new products based on its platform design strategy, which reduces manufacturing costs by: (i) reducing the number of parts used, (ii) increasing the commonality of both handset parts and software, (iii) lowering the number of unique handset designs, and (iv) improving the cycle time of product development through greater standardization of processes. The reduction in the number of products
MANAGEMENT'S DISCUSSION AND ANALYSIS OF FINANCIAL CONDITION AND RESULTS OF OPERATIONS F-19
manufactured and parts complexity of each product also makes it easier for PCS to change its products to meet rapidly-evolving customer demand. The segment also utilized a substantially improved supply-chain process to increase the efficiency of manufacturing activities, thereby reducing costs.
For the full year 2002, PCS recorded net charges of $301 million related to the reorganization of its business and other charges. These charges primarily consisted of: (i) a $119 million net charge for fixed asset impairments, primarily relating to implementation of a plan to close an engineering and distribution center in Harvard, Illinois, (ii) a $125 million charge for the segment's share of a potentially uncollectible finance receivable from Telsim, and (iii) a $70 million net charge related to employee severance costs.
For the full year 2001, PCS recorded net charges of $1.3 billion related to reorganization of its business and other charges. These charges primarily consisted of: (i) $409 million in charges for product portfolio simplification write-offs, (ii) a $285 million charge related to the segment's share of a potentially uncollectible finance receivable from Telsim, (iii) $221 million in reorganization of business charges associated with the closure of a facility in Easter Inch, Scotland, (iv) $55 million in net reorganization of business charges to exit manufacturing activities in Harvard, Illinois, (v) $34 million in reorganization of business charges associated with the segment's plans to discontinue sales of paging products in 2002, and (vi) $250 million in other net segment-wide reorganization of business charges resulting from a significant reduction in workforce and the consolidation of numerous facilities throughout the world.
PCS expects total industry demandsell-through for wireless handsets.
Total industry-wide shipments of wireless telephones in 2000 are estimated2003 to have been 425be between 430 and 440 million units. The Company currently estimates that 2001 industry-wide shipments were approximately 375 million units, down 12% fromTotal industry sell-in is expected to be somewhat lower, due to the prior year. 2001 was the first yearlevel of inventory in the history of the cellular industry in which wireless handset sales declined. The Company believes the factors that impacted lower demand were: (i) the economic recession; (ii) slower-than-expected transition to next-generation data-rich services; (iii) abnormally high inventories in worldwide distribution channels at the beginningend of 2001; (iv)2002. PCS expects its market share to further increase in 2003. ASPs are expected to decline, although at less than the reduction in5-year historical average of 10% to 15% per year. For the level of subsidies offered to consumers, and (v) reduced capital spending levels by wireless service providers.
The loss before income taxes in 2001 was $1.8 billion,full year 2003 compared to a loss of $328 million a year-earlier. The decline in financial performance isthe full year 2002, the segment expects sales to increase. PCS also expects improved operating earnings, primarily due to lower sales, anto: (i) the expected increase in net special charges andsales, (ii) an increaseexpected decrease in manufacturing costs as a percent of sales. Manufacturing costsexpenses as a percent of sales, increased due to the fact that costs decreased at a lower rate than salesbenefits from cost-reduction activities and $549 million of special charges, describedsupply-chain efficiencies, and (iii) an expected significant decrease in more detail below.
The loss before income taxes in 2001 includes $1.4 billion in net special charges, including: (i) $969 million related to reorganization of business charges, of which $549 million was included in manufacturing and other cost of sales; (ii) $285 millioncharges.
Semiconductor Products Segment
The Semiconductor Products segment (SPS) designs, produces and sells embedded processors for customers serving the segment's sharewireless, networking and automotive markets and for standard products. In 2002, SPS net sales represented 18% of the Company's consolidated net sales, compared to 17% in 2001 and 21% in 2000.
| | Years Ended December 31 | Percent Change | |||||||||||
|---|---|---|---|---|---|---|---|---|---|---|---|---|---|
| (Dollars in millions) | 2002 | 2001 | 2000 | 2002 — 2001 | 2001 — 2000 | ||||||||
| Orders | $ | 5,042 | $ | 4,254 | $ | 7,974 | 19% | (47)% | |||||
| Segment net sales | 4,818 | 4,936 | 7,876 | (2)% | (37)% | ||||||||
| Operating earnings (loss) | (1,515 | ) | (1,911 | ) | 202 | 21% | *** | ||||||
In 2002, segment net sales decreased 2% to $4.8 billion, compared to $4.9 billion in 2001. Orders increased 19% to $5.0 billion, compared to $4.3 billion in 2001. The segment's backlog was $1.1 billion at December 31, 2002, compared to $0.9 billion at December 31, 2001.
The semiconductor industry, which traditionally has had volatile sales cycles, had its worst decline in history in 2001, when industry-wide sales were down more than 30% compared to 2000. Industry sales in 2002 were essentially flat with 2001. Average selling prices (ASPs) for the semiconductor industry declined at a higher rate in 2002 than in 2001, primarily as a result of excess manufacturing capacity in the industry. The rate of industry ASP decline slowed towards the end of 2002 in connection with the apparent industry recovery.
SPS's net sales and order results were indicative of the broader conditions in the semiconductor industry. The segment's 19% increase in orders in 2002, compared to 2001, reflected the industry's apparent recovery in the later stages of 2002 as order activity exceeded sales activity. A portion of SPS's product portfolio involves non-proprietary products, which are subject to the intense pricing pressure that is seen in the semiconductor industry. ASPs for these products declined during 2002 in line with industry ASPs. Many of SPS's products involve proprietary technologies. ASPs for these products decline at a much slower rate than those in the semiconductor industry as a whole.
On an end-market basis, in 2002, as compared to 2001, orders were up 18% in the Transportation and Standard Products group, up 14% in the Networking and Computing Systems group and up 38% in the Wireless and Broadband Subscriber Systems group. Sales were up 4% in the Transportation and Standard Products group, up 5% in the Wireless and Broadband Subscriber Systems group and down 12% in the Networking and Computing Systems group.
F-20 MANAGEMENT'S DISCUSSION AND ANALYSIS OF FINANCIAL CONDITION AND RESULTS OF OPERATIONS
reserve relating On a geographic basis, in 2002, as compared to $2.0 billion in financing to Telsim; and (iii) $102 million related to impairments2001, orders were up 12% in the Company's investment portfolio. The 2000 loss before income taxes included $789 million of net special charges, including $838 million for reorganization of businesses charges, of which $716 million was includedAmericas, up 18% in manufacturingEurope and other cost of sales resulting from inventory write offs related to product portfolio changes, partially offset by $68 million of gains from sales of investments and businesses.
During 2001, PCS continued implementing major cost-reduction actions intended to improve the cost structure and competitiveness of the segment. These actions resultedup 27% in a $969 million charge for reorganization of businesses. This charge was comprised primarily of: (i) an additional writedown of the value of inventory, relating to the discontinuation of analog and first-generation digital wireless handsets due to the accelerated erosion of average selling prices in early 2001; (ii) the discontinuation of two-way messaging and one-way paging products; and (iii) charges for exit costs, employee separations and asset write-downs related to portfolio simplification, restructuring of the supply chain and actions taken to reduce costs associated with the segment support organizations. The product portfolio simplification actions resultedAsia. Sales were down 11% in the discontinuation of multiple productsAmericas, down 8% in Europe and up 14% in Asia. The segment sales and order pattern followed the exit of the cellular analog business, reflecting the wireless telephone market technology shiftindustry trend in all regions. The growth in Asia is attributed to digital telephones. The supply-chain actions resulted in downsizing several facilities, exiting facilities in Scotland, India, Illinois and Florida, ceasing manufacturing in Illinois, and consolidating the Georgia distribution facility. The actions related to the segment support organizations resulted in the consolidation of numerous facilities throughout the world and a significant reduction in workforce.
Excluding the impact of net special items from both years, the segment incurred a loss before income taxes in 2001 of $435 million compared to earnings before income taxes in 2000 of $461 million. This reflects the fact that this region attracts a greater percentage of the electronics equipment manufacturing costs decreased at a lower rate than sales. Although manufacturing costsbase.
Other businesses of the Company collectively constitute SPS's largest customer, representing 24% of 2002 segment revenue, as a percent of sales increasedcompared to 22% in 2001 compared to 2000, manufacturing costs as a percent of sales decreased sequentiallyand 25% in both2000. SPS's largest customer within the third and fourth quarters of 2001, reflecting a favorable impact fromCompany is the reorganization of businesses actions taken in 2000 and 2001 and higher average selling prices in the latter half of the year.Personal Communications segment.
In 2002, industry-wide unit shipments of wireless handsets are anticipated to grow approximately 12% to 420 million units, compared to 375 million units in 2001. This anticipated industry growth reflects an expected increase in demand from wireless service providers. Segment sales are anticipated to be higherThe segment's operating loss was $1.5 billion in 2002, compared to 2001 duean operating loss of $1.9 billion in 2001. The decrease in the operating loss was primarily related to: (i) an increase in gross margin, primarily attributed to both the industry-wide unit growth expectationsbenefits from facility consolidation and the segment's intentioncost-reduction actions, and (ii) lower SG&A costs, partially attributed to continue increasing its market share. Higher salesan increase in royalty income from increased unit shipments are expected to beintellectual property licensing, partially offset by lower average selling pricesan increase in reorganization of business and other charges, primarily related to fixed asset impairments. The Company records royalty income as an offset to SG&A expenses. Royalty income for the segment was $182 million in 2002 and $161 million in 2001.
One focus of the segment's cost-reduction activities has been to replace internal manufacturing capacity by outsourcing an increasing percentage of production to foundries and contract houses. At the end of 2002, SPS had reduced its total manufacturing facilities to 12, as compared to 22 manufacturing facilities at the end of 2000. Of the 12 manufacturing facilities at the end of 2002, 9 were wafer fabrication facilities, as compared to 16 wafer fabrication facilities at the end of 2000. By mid-2003, SPS expects to reduce its total manufacturing facilities to 10, of which 8 will be wafer fabrication facilities.
For the full year 2002, SPS recorded net charges of $1.2 billion related to the reorganization of its business and other charges. These charges primarily related to: (i) $1.1 billion of asset impairments related to facilities in Arizona, China and Scotland, as the segment executed upon its business model to reduce the number of wafer fabrication facilities, and (ii) $80 million for potential repayments of incentives.
For the full year 2001, SPS recorded net charges of $911 million related to reorganization of its business and other charges. These charges primarily related to: (i) $443 million for fixed asset impairments, and (ii) $386 million for segment-wide employee severance costs incurred in the closure of 8 factories.
The segment continues to implement its "asset light" business model, which is aimed at achieving substantial improvements in future profitability and cash flow performance by: (i) improving asset efficiency, (ii) maximizing the return on research and development, and (iii) reducing the segment's historical ratio of capital expenditures to sales. Capital expenditures in the segment decreased 64% to $220 million, or 4.6% of segment net sales, in 2002, compared to 2001. However, the downward pressure on average selling prices in 2002 is expected to be much lower than the long-term historical decline rate. Excluding the impact$613 million, or 12.4% of special items, the segment expects to return to profitability in 2002 as a result of both anticipated highernet sales, and an ongoing favorable impact from the cost-reduction actions taken in 2001. Both amounts represent significantly lower capital expenditure levels than in 2000 and earlier years.
Industry growthDue to ongoing economic uncertainty, particularly in light of world events, it has been, and may continuebecome increasingly difficult to be, affected byestimate the cost of new licenses required to use radio frequencies. Typically, governments sell these licenses at auctions. Over the last several years, the cost of these licenses has increased significantly, particularly for frequencies used in connection with 3G technology. The significant cost for licenses has slowed, and may continue to slow, the2003 growth of the industry. Growth is slowed because some operators have funding constraints limiting their ability to purchase new licenses or purchase new technology to upgrade their systems. The segment's results have been, and couldsemiconductor industry markets served by the segment. Market analysts' estimates of 2003 market growth continue to be, affected byvary widely, and now range from 0% to 22% growth. The segment expects its sales to increase at a rate that is comparable to industry growth in the costmarkets it serves. The segment also expects improved operating results due to the expected increase in sales, the benefits of these licenses.lower manufacturing expenses due to cost-reduction activities, and a significant decrease in reorganization of business and other charges.
Global Telecom SolutionsSemiconductor Products Segment
| | Years ended December 31 | ||||||||||
|---|---|---|---|---|---|---|---|---|---|---|---|
| ($ in millions) | 2001 | 2000 | 1999 | ||||||||
| Orders | $ | 6,231 | $ | 7,559 | $ | 6,510 | |||||
| % change from prior year | -18% | 16% | 2% | ||||||||
| Segment sales | $ | 6,548 | $ | 7,791 | $ | 6,544 | |||||
| % change from prior year | -16% | 19% | -7% | ||||||||
| Earnings (loss) before income taxes | $ | (1,413 | ) | $ | 846 | $ | (479 | ) | |||
| % change from prior year | -267% | 277% | -158% | ||||||||
| Special items: income (charge) | |||||||||||
| Telsim receivable charge | $ | (1,071 | ) | $ | — | $ | — | ||||
| Reorganization of businesses | (345 | ) | (131 | ) | 67 | ||||||
| Gain on sale of investments/businesses | 39 | 1 | — | ||||||||
| Iridium related | — | — | (1,325 | ) | |||||||
| Other | (25 | ) | (3 | ) | (17 | ) | |||||
| Net special items | $ | (1,402 | ) | $ | (133 | ) | $ | (1,275 | ) | ||
| Earnings (loss) before income taxes, excluding special items | $ | (11 | ) | $ | 979 | $ | 796 | ||||
| % change from prior year | -101% | 23% | -19% | ||||||||
MANAGEMENT'S DISCUSSION AND ANALYSIS OF FINANCIAL CONDITION AND RESULTS OF OPERATIONS F-21
The Global Telecom SolutionsSemiconductor Products segment (GTSS) primarily(SPS) designs, manufactures,produces and sells installs,embedded processors for customers serving the wireless, networking and services wireless infrastructure communication systems, including hardwareautomotive markets and software. The segment's wireless infrastructure product portfolio includes electronic exchanges (such as telephone switches), base site controllersfor standard products. In 2002, SPS net sales represented 18% of the Company's consolidated net sales, compared to 17% in 2001 and radio base stations for iDEN®, Code Division Multiple Access (CDMA), Global System for Mobile Communications (GSM) and Personal Digital Cellular (PDC) technologies. Products are marketed to wireless service providers worldwide through a direct sales force, licensees or agents.21% in 2000.
| | Years Ended December 31 | Percent Change | |||||||||||
|---|---|---|---|---|---|---|---|---|---|---|---|---|---|
| (Dollars in millions) | 2002 | 2001 | 2000 | 2002 — 2001 | 2001 — 2000 | ||||||||
| Orders | $ | 5,042 | $ | 4,254 | $ | 7,974 | 19% | (47)% | |||||
| Segment net sales | 4,818 | 4,936 | 7,876 | (2)% | (37)% | ||||||||
| Operating earnings (loss) | (1,515 | ) | (1,911 | ) | 202 | 21% | *** | ||||||
In 2001,2002, segment net sales decreased 16%2% to $6.5 billion and orders decreased 18% to $6.2 billion. The decrease in sales is due to lower unit demand for wireless infrastructure equipment by service providers and lower selling prices. Segment sales of equipment for all technologies was down in 2001. Wireless infrastructure sales and orders were down in the Americas and Asia and down significantly in Europe. Industry sales were slightly lower in 2001 compared to 23% growth in 2000 and 2001 was the first year in that sales of infrastructure declined. Service providers spent less on new equipment because of the economic recession, severe pressure to keep their costs down, lower ARPU (average revenue per user) and, for many, higher debt burdens. Also, the limited availability of handsets and lower than expected consumer demand for GPRS (General Packet Radio Service) caused lower than anticipated purchases of GPRS infrastructure equipment.
In 2001, the segment incurred a loss before income taxes of $1.4$4.8 billion, compared to earnings before income taxes of $846 million a year ago.$4.9 billion in 2001. Orders increased 19% to $5.0 billion, compared to $4.3 billion in 2001. The segment's backlog was $1.1 billion at December 31, 2002, compared to $0.9 billion at December 31, 2001.
The semiconductor industry, which traditionally has had volatile sales cycles, had its worst decline in financial performancehistory in 2001, when industry-wide sales were down more than 30% compared to 2000 is due to a decrease in both unit sales and average selling prices and an increase in net special charges. The 2001 loss includes $1.4 billion of net special charges, comprised primarily of: (i) $1.1 billion for the segment's share of the Company's reserve relating to $2.0 billion in financing to Telsim, and (ii) $345 million for reorganization of businesses charges intended to reduce future operating costs. Because the segment's business is heavily dependent on the development of new technologies and rapid time-to-market, GTSS preserved the level of its research and development expenditures. Accordingly, cost-reduction programs for the segment have been focused in the area of selling, general and administrative expenses. As part of its cost-reduction program, GTSS has reduced the number of employees in its business by approximately 20% since the end of 2000 and is completing previously-announced actions that will further reduce the number of employees by an additional 5% by the end of March 2002. Also, administrative facilities were closed and manufacturing facilities were consolidated.
The 2000 earnings before income taxes included net special items of $133 million, comprised primarily of $131 million of reorganization of businesses charges for the exit of the fixed wireless businesses.
Excluding net special items, the segment incurred a loss before income taxes of $11 million in 2001 compared to earnings before income taxes of $979 million in 2000. The decline in financial performance compared to a year ago is due to the decreases in both unit sales and average selling prices discussed above.
The Company anticipates that industry-wideIndustry sales in 2002 will decrease by as much as 10% compared to 2001 due to lower anticipated capital expenditures by wireless service providers. In addition, service providers are slowing or postponing the build-out of the next-generation 3G systems, particularly those known as UMTS (Universal Mobile Telecommunications System). UMTS systems are high-capacity wireless networks that are designed to provide enhanced data services, improved Internet access and increased voice capacity. Several factors are impacting this build-out, including: (i) the fact that the operators may have funding constraints limiting their ability to purchase 3G infrastructure equipment because of the very substantial fees they paid for 3G licenses; (ii) issues associatedwere essentially flat with the introduction of very complex new technology; (iii) development of new data applications, and (iv) handset availability. GTSS expects service providers to use GPRS (General Packet Radio Service) to grow their data subscriber base and to build their business case for these next-generation systems and to broadly implement UMTS in large volumes around 2004, due to the need for expanded voice capacity and to support new data services. Segment sales in 2002 are anticipated to be lower than in 2001 due to the anticipated lower industry sales.
Excluding the impact of special items, the segment expects its financial results to improve in 2002 due to a favorable impact from the cost-reduction actions taken in 2001.
GTSS has experienced significant competition in the market for digital products, especially as the industry transitions to 3G technology. GTSS is a supplier of 3G equipment for both CDMA 1X and UMTS technologies. The segment has a strong position in CDMA 1X, with 10 contract awards in 2001, bringing the total number of CDMA 1X awards to 15. The first wave of UMTS contracts has favored core network suppliers, and GTSS has not received as high of a percentage of the UMTS contracts awarded as it has for previous technologies.
The nature of GTSS' business is large, long-term contracts with major operators that require sizeable investments by our customers, often more than $100 million. In 2001, two customers represented approximately 35% of our sales (Nextel, Inc. and KDDI, a service provider in Japan). In 2001, we announced major new infrastructure contracts with China Unicom and China Mobile totaling over $1.4 billion. We expect shipments under these contracts to be completed in 2002. The individual loss of any of our large customers could have a material adverse affect on the segment's business. Further, because our contracts are long-term, the loss of a major customer would impact performance in several quarters.
Nextel is an important customer and GTSS has been their primary supplier of network equipment for over ten years. Nextel uses Motorola's proprietary iDEN technology to support its Nextel Direct Connect™ service. GTSS's contracts with Nextel are non-exclusive. Although the relationship is strong, Nextel is free to evaluate other suppliers and technologies, and Motorola cannot be assured of its supplier status as Nextel considers its options with respect to next-generation technology.
F-22 MANAGEMENT'S DISCUSSION AND ANALYSIS OF FINANCIAL CONDITION AND RESULTS OF OPERATIONS
The competitive environment in which GTSS operates may require the Company to provide significant amounts of long-term customer financing in order to be awarded new contracts. Customer financing arrangements may include all or a portion of the purchase price Average selling prices (ASPs) for the Company's products and services, plus working capital for the customer. Whenever possible the Company assists customers in obtaining financing from banks and other sources before providing financing itself. The success of the GTSS infrastructure business, may be dependent, in part, upon the ability of the Company to provide customer financing on competitive terms. During 2001, GTSS significantly reduced the amount of outstanding financing commitments and outstanding financial guarantees to third-parties for its customers. In 2002, the segment expects to provide financing support to its customers while continuing to limit its financing exposure.
While the Company has generally been able to placesemiconductor industry declined at a portion of its customer financings with third-party lenders, a portion of these financings are supported directly by the Company. There can be higher risks associated with some financings, particularly when provided to start-up operations such as local network providers, to customers in developing countries, or to customers in specific financing-intensive areas of the industry (such as 3G wireless operators). During 2001, the Company had $1.5 billion in special charges related to potentially uncollectible long-term finance receivables. GTSS's share of these charges was $1.1 billion. Should additional customers fail to meet their repayment obligations, losses could be incurred and such losses could have an adverse effect on the Company.
Industry growth has been, and may continue to be, affected by the cost of new licenses required to use radio frequencies. Typically, governments sell these licenses at auctions. Over the last several years, the cost of these licenses has increased significantly, particularly for frequencies used in connection with 3G technology. The significant cost for licenses has slowed, and may continue to slow, the growth of the industry. Growth is slowed because some operators have funding constraints limiting their ability to purchase new licenses or purchase new technology to upgrade their systems. The segment's results have been, and could continue to be, affected by the cost of these licenses.
Commercial, Government and Industrial Solutions Segment
| | Years ended December 31 | |||||||||
|---|---|---|---|---|---|---|---|---|---|---|
| ($ in millions) | 2001 | 2000 | 1999 | |||||||
| Orders | $ | 4,469 | $ | 4,947 | $ | 4,733 | ||||
| % change from prior year | -10% | 5% | 18% | |||||||
| Segment sales | $ | 4,318 | $ | 4,580 | $ | 4,068 | ||||
| % change from prior year | -6% | 13% | 0% | |||||||
| Earnings before income taxes | $ | 508 | $ | 434 | $ | 609 | ||||
| % change from prior year | 17% | -29% | 48% | |||||||
| Special items: income(charge) | ||||||||||
| Gain on sale of investments/businesses | $ | 571 | $ | 7 | $ | 198 | ||||
| Reorganization of businesses | (200 | ) | (52 | ) | — | |||||
| Dolphin Telecom receivable charge | (88 | ) | — | — | ||||||
| Investment impairments | (77 | ) | — | — | ||||||
| Other | (55 | ) | (47 | ) | (16 | ) | ||||
| Net special items | $ | 151 | $ | (92 | ) | $ | 182 | |||
| Earnings before income taxes, excluding special items | $ | 357 | $ | 526 | $ | 427 | ||||
| % change from prior year | -32% | 23% | -8% | |||||||
The Commercial, Government and Industrial Solutions segment (CGISS) primarily designs, manufactures, sells, installs and services analog and digital two-way radio voice and data products and privately-operated systems to a wide range of governmental and industrial customers worldwide. In addition, CGISS participates in the emerging market of integrated command and control solutions for public-safety and enterprise customers. CGISS also provides network services for two-way radio subscribers in international markets through joint ventures.
In 2001, segment sales decreased 6% to $4.3 billion and orders decreased 10% to $4.5 billion due to reduced capital spending by service providers for constructing, rebuilding or upgrading their communications systems. Orders were flat in the Americas, down in Europe and down significantly in Asia. Sales were flat in the Americas and Asia and down significantly in Europe.
In 2001, earnings before income taxes increased 17% to $508 million compared to $434 million a year ago. Earnings increased due to income from net special items of $151 million in 2001 compared to net special charges of $92 million in 2000, partially offset by lower sales and higher manufacturing costs as a percent of sales in 2001 compared to 2000. The income from net special items in
MANAGEMENT'S DISCUSSION AND ANALYSIS OF FINANCIAL CONDITION AND RESULTS OF OPERATIONS F-23
2001 was comprised of $571 million of gains on sales of investments and businesses, partially offset by $420 million of special charges. Gains on sales of investments and businesses primarily reflect a $526 million gain related to the sale of the Integrated Information Systems Group (IISG). The 2001 special charges of $420 million include: (i) $200 million for reorganization of businesses charges, primarily for employee separations and exit costs, (ii) $88 million related to potentially uncollectible long-term finance receivables related to Dolphin Telecom, and (iii) $77 million for impairments in the Company's investment portfolio. Earnings before income taxes in 2000 included net special charges of $92 million, comprised primarily of $52 million for reorganization of businesses charges and a $28 million charge for the write-off of acquired in-process research and development related to the acquisitions of Printrak International, Inc., Intec, Ltd. and Communication Systems Technology, Inc.
During 2001, CGISS implemented a series of cost-reduction actions designed to improve its financial performance, including: (i) completing the shutdown of manufacturing operations in Mount Pleasant, Iowa with the outsourcing of its radio manufacturing operation; (ii) closing its Atlanta, Georgia distribution center; and (iii) consolidating its U.S. distribution operations in Elgin, Illinois. CGISS also tightened controls over operating budgets and reduced its number of employees by 28% since year-end 2000.
During 2001, CGISS divested a number of non-strategic elements of its business portfolio. The largest of these was the sale of the Integrated Information Solutions Group (IISG), a supplier of advanced government electronics and communications solutions primarily for military and space applications. In addition, the segment sold its RFID (radio frequency identification) business and interests in the ERG Smartcard Alliance and exited the BiStatix™ products business. These portfolio changes have allowed the segment to intensify its focus on growth opportunities in integrated communications and information solutions.
Orders, sales and earnings before income taxes for IISG through the date of its sale in 2001 were approximately $499 million, $456 million and $39 million, respectively and were approximately $754 million, $572 million and $34 million, respectively, for 2000. Orders, sales and earnings for other exited businesses were not significant to the financial results of the segment.
Financial results for the segment's ongoing businesses, excluding the impact of the exited IISG business and net special items, were:
CGISS Results of Operations for Ongoing Businesses, Excluding Special Items
| | Years ended December 31 | ||||||||
|---|---|---|---|---|---|---|---|---|---|
| ($ in millions) | 2001 | 2000 | 1999 | ||||||
| Orders | $ | 3,970 | $ | 4,193 | $ | 4,034 | |||
| Sales | $ | 3,862 | $ | 4,008 | $ | 3,420 | |||
| Earnings before income taxes | $ | 318 | $ | 492 | $ | 389 | |||
Excluding the impact of net special items and exited businesses from both years, sales decreased 4% in 2001 from $4.0 billion to $3.9 billion and orders decreased 5% in 2001 from $4.2 billion to $4.0 billion. Earnings before income taxes decreased 35% from $492 million to $318 million. The decrease in earnings is due to lower sales and an increase in manufacturing costs as a percent of sales, partially offset by lower selling, general and administrative costs resulting from the reorganization of businesses programs implemented.
The Company anticipates that worldwide industry sales in 2002 for the two-way radio market will increase compared to 2001 due to increased unit demand for two-way radio products and systems. CGISS sales in 2002 are expected to be lower than in 2001 due to the sale of the IISG business in the third quarter of 2001. Excluding sales from this exited business, segment sales in 2002 are anticipated to be higher than in 2001 due to the industry sales growth expectations.
The segment expects earnings before income taxes to be lowerrate in 2002 than in 2001, because 2001 included a large non-recurring gain from the sale of IISG. Excluding the impact of net special items and exited businesses from both years, the segment expects earnings before income taxes to increase in 2002primarily as a result of anexcess manufacturing capacity in the industry. The rate of industry ASP decline slowed towards the end of 2002 in connection with the apparent industry recovery.
SPS's net sales and order results were indicative of the broader conditions in the semiconductor industry. The segment's 19% increase in sales and a favorable impact fromorders in 2002, compared to 2001, reflected the reorganization of businesses programs implemented throughout 2001.
CGISS's products are marketed primarily to private radio system operators and public-safety providers worldwide. Demand for the segment's products will depend primarily on capital spending by these service providers for constructing, rebuilding or upgrading their communications systems. The amount of capital spending by these customers will be affected by a variety of factors, including general economic conditions, budget levels of governmental and other public agencies, and new legislation and regulations affecting the equipment sold by the segment.
Significant eventsindustry's apparent recovery in the later partstages of 2002 as order activity exceeded sales activity. A portion of SPS's product portfolio involves non-proprietary products, which are subject to the intense pricing pressure that is seen in the semiconductor industry. ASPs for these products declined during 2002 in line with industry ASPs. Many of SPS's products involve proprietary technologies. ASPs for these products decline at a much slower rate than those in the semiconductor industry as a whole.
On an end-market basis, in 2002, as compared to 2001, have heightenedorders were up 18% in the need for safetyTransportation and security solutions worldwide. Public-safety, governmentStandard Products group, up 14% in the Networking and enterprise organizations areComputing Systems group and up 38% in the Wireless and Broadband Subscriber Systems group. Sales were up 4% in the Transportation and Standard Products group, up 5% in the Wireless and Broadband Subscriber Systems group and down 12% in the Networking and Computing Systems group.
F-24F-20 MANAGEMENT'S DISCUSSION AND ANALYSIS OF FINANCIAL CONDITION AND RESULTS OF OPERATIONS
seeking On a wide rangegeographic basis, in 2002, as compared to 2001, orders were up 12% in the Americas, up 18% in Europe and up 27% in Asia. Sales were down 11% in the Americas, down 8% in Europe and up 14% in Asia. The segment sales and order pattern followed the industry trend in all regions. The growth in Asia is attributed to the fact that this region attracts a greater percentage of detectionthe electronics equipment manufacturing base.
Other businesses of the Company collectively constitute SPS's largest customer, representing 24% of 2002 segment revenue, as compared to 22% in 2001 and prevention capabilities, as well as communications interoperability and information-sharing across many users, and integrated voice, data and video capabilities. CGISS has been a leader25% in providing mission-critical communications and information solutions for more than 60 years, and2000. SPS's largest customer within the businessCompany is well-positioned to participate in this emerging opportunity as customers solidify their funding for safety and security.
Broadbandthe Personal Communications Segmentsegment.
| | Years ended December 31 | |||||||||
|---|---|---|---|---|---|---|---|---|---|---|
| ($ in millions) | 2001 | 2000 | 1999 | |||||||
| Orders | $ | 2,837 | $ | 3,791 | $ | 2,693 | ||||
| % change from prior year | -25% | 41% | 11% | |||||||
| Segment sales | $ | 2,855 | $ | 3,416 | $ | 2,532 | ||||
| % change from prior year | -16% | 35% | 16% | |||||||
| Earnings (loss) before income taxes | $ | (436 | ) | $ | 1,251 | $ | 294 | |||
| % change from prior year | -135% | 325% | 74% | |||||||
| Special items: income (charge) | ||||||||||
| Investment impairments | $ | (661 | ) | $ | — | $ | — | |||
| Reorganization of businesses | (146 | ) | (30 | ) | — | |||||
| Litigation/arbitration settlements | (33 | ) | (87 | ) | — | |||||
| Sale of investments/businesses | — | 851 | 67 | |||||||
| Other | (76 | ) | (42 | ) | �� | (112 | ) | |||
| Net special items | $ | (916 | ) | $ | 692 | $ | (45 | ) | ||
| Earnings (loss) before income taxes, excluding special items | $ | 480 | $ | 559 | $ | 339 | ||||
| % change from prior year | -14% | 65% | 56% | |||||||
The Broadband Communications segment (BCS) designs, manufactures and sells: (i) digital systems and set-top terminals for broadband cable and satellite television networks; (ii) high speed data products, including cable modems and cable modem termination systems (CMTS), as well as Internet Protocol (IP)-based telephony products; (iii) hybrid fiber/coaxial network transmission systems used by cable television operators; (iv) digital satellite television systems for programmers; (v) direct-to-home (DTH) satellite networks and private networks for business communications, and (vi) digital broadcast products for the cable and broadcast industries. Products are marketed primarily to cable television operators, satellite television programmers, and other communications providers worldwide.
In 2001, segment sales declined 16% to $2.9segment's operating loss was $1.5 billion and orders declined 25% to $2.8 billion. These declines resulted from a slow down by cable service providers in making capital investments, including purchases of hybrid fiber/coaxial network transmission systems. The majority of the segment's sales and orders continued to be in North America.
In 2001, the segment had a loss before income taxes of $436 million2002, compared to earnings before income taxesan operating loss of $1.3$1.9 billion a year ago.in 2001. The decline in financial performance is due to the decrease in salesthe operating loss was primarily related to: (i) an increase in gross margin, primarily attributed to benefits from facility consolidation and $916 million of net special chargescost-reduction actions, and (ii) lower SG&A costs, partially attributed to an increase in 2001 compared to $692 million ofroyalty income from net special itemsintellectual property licensing, partially offset by an increase in 2000. The $916 million of net special charges in 2001 included: (i) $661 million for impairments in the Company's investment portfolio; (ii) $146 million for reorganization of businessesbusiness and other charges, primarily related to employee separations and inventory write-downs relatedfixed asset impairments. The Company records royalty income as an offset to end-of-life products; (iii) $33 millionSG&A expenses. Royalty income for litigation settlements, and (iv) $76 million of other charges. 2000 earnings included $692 million of net special income items, comprised primarily of $851 million of gains from the sale of investments, partially offset by an $87 million litigation settlement, $30 million of inventory writedowns and $42 million of other charges.
As a result of overall economic conditions and reduced cable operator spending, the segment took actions during 2001was $182 million in 2002 and $161 million in 2001.
One focus of the segment's cost-reduction activities has been to reducereplace internal manufacturing selling, generalcapacity by outsourcing an increasing percentage of production to foundries and administrative costs. Consistent with existing business conditions, manufacturing headcount was reduced and two manufacturing locations were consolidated to reduce manufacturing costs. In addition, selling, general and administrative spending was reduced, including the reduction of employees in this area by approximately 20% sincecontract houses. At the end of 2000.
Excluding the impact of net special items, earnings before income taxes decreased 14%2002, SPS had reduced its total manufacturing facilities to $480 million in 200112, as compared to $55922 manufacturing facilities at the end of 2000. Of the 12 manufacturing facilities at the end of 2002, 9 were wafer fabrication facilities, as compared to 16 wafer fabrication facilities at the end of 2000. By mid-2003, SPS expects to reduce its total manufacturing facilities to 10, of which 8 will be wafer fabrication facilities.
For the full year 2002, SPS recorded net charges of $1.2 billion related to the reorganization of its business and other charges. These charges primarily related to: (i) $1.1 billion of asset impairments related to facilities in Arizona, China and Scotland, as the segment executed upon its business model to reduce the number of wafer fabrication facilities, and (ii) $80 million for potential repayments of incentives.
For the full year 2001, SPS recorded net charges of $911 million related to reorganization of its business and other charges. These charges primarily related to: (i) $443 million for fixed asset impairments, and (ii) $386 million for segment-wide employee severance costs incurred in 2000. Earningsthe closure of 8 factories.
The segment continues to implement its "asset light" business model, which is aimed at achieving substantial improvements in future profitability and cash flow performance by: (i) improving asset efficiency, (ii) maximizing the return on research and development, and (iii) reducing the segment's historical ratio of capital expenditures to sales. Capital expenditures in the segment decreased 64% to $220 million, or 4.6% of segment net sales, in 2002, compared to $613 million, or 12.4% of segment net sales, in 2001. Both amounts represent significantly lower capital expenditure levels than in 2000 and earlier years.
Due to ongoing economic uncertainty, particularly in light of world events, it has become increasingly difficult to estimate the 2003 growth of the semiconductor industry markets served by the segment. Market analysts' estimates of 2003 market growth continue to vary widely, and now range from 0% to 22% growth. The segment expects its sales to increase at a rate that is comparable to industry growth in the markets it serves. The segment also expects improved operating results due to the declineexpected increase in sales, partially offset by lower selling, general and administrative expenses resulting from the benefits of thelower manufacturing expenses due to cost-reduction activities, and a significant decrease in reorganization of businesses programs implemented in 2001.
Segment sales in 2002 are expected to decline versus 2001 due to anticipated further reductions in capital spending and tighter inventory management by cable service providers and reduced modem sales prices. The segment expects to return to profitability in 2002 due to an expectation that the special charges which caused the segment's loss in 2001
MANAGEMENT'S DISCUSSION AND ANALYSIS OF FINANCIAL CONDITION AND RESULTS OF OPERATIONS F-25
will not be repeated to the same degree in 2002, as well as a favorable impact from reorganization of businesses programs implemented throughout 2001.
In late 2001 and early 2002, the segment continued its strategy of enhancing its end-to-end infrastructure product portfolio to address the emerging needs of broadband operators. In October 2001, the segment completed the acquisition of RiverDelta Networks, Inc., a leading provider of carrier-class broadband routing, switching, cable modem termination system (CMTS), and service management solutions. The addition of RiverDelta has increased the segment's technical expertise and product offerings, with products ranging from high-density solutions for operators who want to support advanced services, to modular configurations for small/distributed networks. In January 2002, BCS completed the acquisition of Synchronous, Inc., a leading provider of fiber optic systems for video, data and voice transmission. The addition of the Synchronous technical staff and optical networking technology expands the segment's infrastructure product suite to provide broadband network operators with the solutions they require to deliver an increasing number of data-intensive services.
Because of continuing consolidation within the cable industry worldwide, a small number of operators own a majority of cable television systems and account for a significant portion of the capital spending made by cable television system operators. Last year, sales to BCS's two largest customers, AT&T Broadband and Charter Communications, represented 32% of total sales. The loss of business from either of these customers or any other significant operator could have a material adverse effect on the segment's business. The segment does not have any material long-term contracts with its customers.
The segment's products are marketed primarily to cable television operators, satellite television programmers, and other communications providers worldwide. Demand for BCS's products depends primarily on capital spending by these communications providers to construct, rebuild or upgrade their communications systems. The amount of capital spending by these customers is affected by a variety of factors, including: general economic conditions; the continuing trend of consolidation within the cable industry; the financial condition of cable television system operators and alternative communications providers, including their access to financing; technological developments; standardization efforts that impact the deployment of new equipment, and new legislation and regulations affecting the equipment sold by the segment. Due to the economic recession in 2001, the segment's customers significantly reduced their capital spending from 2000 levels. The Company expects this trend to continue in 2002.charges.
Semiconductor Products Segment
| | Years ended December 31 | |||||||||
|---|---|---|---|---|---|---|---|---|---|---|
| ($ in millions) | 2001 | 2000 | 1999 | |||||||
| Orders | $ | 4,254 | $ | 7,974 | $ | 8,077 | ||||
| % change from prior year | -47% | -1% | 9% | |||||||
| Segment sales | 4,936 | 7,876 | 7,370 | |||||||
| % change from prior year | -37% | 7% | 1% | |||||||
| Earnings (loss) before income taxes | (2,142 | ) | 163 | 619 | ||||||
| % change from prior year | *** | -74% | 151% | |||||||
| Special items: income (charge) | ||||||||||
| Reorganization of businesses | (841 | ) | (274 | ) | — | |||||
| Gain (loss) on sale of investments/businesses | — | 43 | 373 | |||||||
| In-process research and development | — | (224 | ) | (42 | ) | |||||
| Other | (93 | ) | (59 | ) | (5 | ) | ||||
| Net special items | (934 | ) | (514 | ) | 326 | |||||
| Earnings (loss) before income taxes, excluding special items | $ | (1,208 | ) | $ | 677 | $ | 293 | |||
| % change from prior year | -278% | 131% | 166% | |||||||
*** Percent change not considered meaningful
The Semiconductor Products segment (SPS) designs, produces and sells embedded processors for customers serving the wireless, networking and computing, transportationautomotive markets and for standard product, and wireless/broadband markets.products. In 2002, SPS offers multiple technologies enabling customers to develop smarter, faster, and synchronized products for the person, work team, home and automobile. The markets served by SPS represent approximately 90%net sales represented 18% of the total worldwide semiconductor industry.Company's consolidated net sales, compared to 17% in 2001 and 21% in 2000.
| | Years Ended December 31 | Percent Change | |||||||||||
|---|---|---|---|---|---|---|---|---|---|---|---|---|---|
| (Dollars in millions) | 2002 | 2001 | 2000 | 2002 — 2001 | 2001 — 2000 | ||||||||
| Orders | $ | 5,042 | $ | 4,254 | $ | 7,974 | 19% | (47)% | |||||
| Segment net sales | 4,818 | 4,936 | 7,876 | (2)% | (37)% | ||||||||
| Operating earnings (loss) | (1,515 | ) | (1,911 | ) | 202 | 21% | *** | ||||||
In 2001,2002, segment net sales decreased 37%2% to $4.8 billion, compared to $4.9 billion and orders declined 47%in 2001. Orders increased 19% to $5.0 billion, compared to $4.3 billion. Segment sales growthbillion in 2001. The segment's backlog was negatively impacted by the cyclical downturn of the semiconductor industry that began in the second half of 2000 and continued throughout$1.1 billion at December 31, 2002, compared to $0.9 billion at December 31, 2001. In 2001, sales in
F-26 MANAGEMENT'S DISCUSSION AND ANALYSIS OF FINANCIAL CONDITION AND RESULTS OF OPERATIONS
both the worldwide semiconductor industry and the markets served by SPS experienced a decline of 32% percent. The semiconductor industry, which traditionally has had volatile sales cycles, had its worst decline in history in 2001, when industry-wide sales were down more than 30% compared to 2000. Industry sales in 2002 were essentially flat with 2001. Average selling prices (ASPs) for the semiconductor productsindustry declined at a higher rate in 2002 than in 2001, primarily as manufacturers aggressively priced their products in response to declining demand. The industry was negatively impacted bya result of excess manufacturing capacity in a declining market. Over the past several yearsindustry. The rate of industry ASP decline slowed towards the end of 2002 in connection with the apparent industry recovery.
SPS's net sales and throughoutorder results were indicative of the industry, manufacturers have been increasing capacity, much of which was not needed as demand for semiconductor products began to dropbroader conditions in the second halfsemiconductor industry. The segment's 19% increase in orders in 2002, compared to 2001, reflected the industry's apparent recovery in the later stages of 2000 and continued2002 as order activity exceeded sales activity. A portion of SPS's product portfolio involves non-proprietary products, which are subject to drop throughout 2001.the intense pricing pressure that is seen in the semiconductor industry. ASPs for these products declined during 2002 in line with industry ASPs. Many of SPS's products involve proprietary technologies. ASPs for these products decline at a much slower rate than those in the semiconductor industry as a whole.
On an end-market basis, in 2002, as compared to 2001, orders were down very significantlyup 18% in the Transportation and Standard Products group, up 14% in the Networking and Computing Systems Group, down significantlygroup and up 38% in the Wireless and Broadband Subscriber Systems Group and downgroup. Sales were up 4% in the Transportation and Standard Products Group. Sales weregroup, up 5% in the Wireless and Broadband Subscriber Systems group and down significantly12% in the Networking and Computing Systems and Wireless and Broadband Subscriber Systems Groups and down in the Transportation Standard Products Group.group.
F-20 MANAGEMENT'S DISCUSSION AND ANALYSIS OF FINANCIAL CONDITION AND RESULTS OF OPERATIONS
On a geographic basis, in 2002, as compared to 2001, orders were down very significantlyup 12% in the Americas, up 18% in Europe and Europe, down significantlyup 27% in Japan and down in the Asia/Pacific region.Asia. Sales were down significantly11% in the Americas, anddown 8% in Europe and downup 14% in Asia. The segment sales and order pattern followed the industry trend in all other regions. SalesThe growth in Asia is attributed to Motorola internal business units consumed 22%the fact that this region attracts a greater percentage of the segment's outputelectronics equipment manufacturing base.
Other businesses of the Company collectively constitute SPS's largest customer, representing 24% of 2002 segment revenue, as compared to 22% in 2001 compared withand 25% in 2000. SPS's largest customer within the Company is the Personal Communications segment.
In 2001,The segment's operating loss was $1.5 billion in 2002, compared to an operating loss of $1.9 billion in 2001. The decrease in the operating loss was primarily related to: (i) an increase in gross margin, primarily attributed to benefits from facility consolidation and cost-reduction actions, and (ii) lower SG&A costs, partially attributed to an increase in royalty income from intellectual property licensing, partially offset by an increase in reorganization of business and other charges, primarily related to fixed asset impairments. The Company records royalty income as an offset to SG&A expenses. Royalty income for the segment incurred a loss before income taxes of $2.1 billion compared with earnings before income taxes of $163was $182 million in 2000. The loss for 2001 included $9342002 and $161 million of net special charges, comprised primarily of: (i) $841 million of charges for reorganization of businesses, of which $228 million was included in manufacturing and other costs of sales; (ii) $25 million for intangible asset impairments, and (iii) $23 million for impairments in the Company's investment portfolio. The reorganization of businesses charges were primarily for asset writedowns and employee separation charges related to the closure of eight factories. 2000 earnings included $514 million of net special charges, comprised primarily of: (i) $274 million of charges for reorganization of businesses related to the closure of three factories; (ii) $224 million of charges for the write-off of acquired in-process research and development related to the acquisition of C-Port Corporation, Wavemark Technologies, Inc. and HIWARE AG, and (iii) $43 million of gains from the sale of investments.2001.
During 2001, the segment implemented a cost-reduction program designed to improve performance. AOne focus of the segment's newcost-reduction activities has been to replace internal manufacturing capacity by outsourcing an increasing percentage of production to foundries and contract houses. At the end of 2002, SPS had reduced its total manufacturing facilities to 12, as compared to 22 manufacturing facilities at the end of 2000. Of the 12 manufacturing facilities at the end of 2002, 9 were wafer fabrication facilities, as compared to 16 wafer fabrication facilities at the end of 2000. By mid-2003, SPS expects to reduce its total manufacturing facilities to 10, of which 8 will be wafer fabrication facilities.
For the full year 2002, SPS recorded net charges of $1.2 billion related to the reorganization of its business and other charges. These charges primarily related to: (i) $1.1 billion of asset impairments related to facilities in Arizona, China and Scotland, as the segment executed upon its business model is to substantially reduce fixed asset expenditures and increase utilization rates. This includes sizing the organization to reflect the current business environment, closing older, less-efficient factories and moving the loadings into remaining manufacturing facilities. Employment reductions completed in 2001 totaled approximately 4,000, with an additional 6,000 reductions announced for completion during 2002. In total, these reductions represent 28% of SPS's workforce at 2000 year end. The announced manufacturing closures and phase-outs will decrease the number of operatingwafer fabrication facilities, and high-volume assembly/test sites from 22(ii) $80 million for potential repayments of incentives.
For the full year 2001, SPS recorded net charges of $911 million related to reorganization of its business and other charges. These charges primarily related to: (i) $443 million for fixed asset impairments, and (ii) $386 million for segment-wide employee severance costs incurred in 2000the closure of 8 factories.
The segment continues to 10implement its "asset light" business model, which is aimed at year-end 2002. In 2002, SPS will completely or partially shut-down facilitiesachieving substantial improvements in Sendai, Japan; Hong Kong; South Queensferry, Scotland; Austin, Texas,future profitability and Mesa, Arizona. When economically feasible, SPS plans to resume using foundries for a larger percentage of standard manufacturing, while using its facilities primarily to produce leading-edge and specialty technologies. SPS also will rely increasinglycash flow performance by: (i) improving asset efficiency, (ii) maximizing the return on joint ventures and partnerships to share the costs of funding major capital projects and research and development.
Additionally, a focus ofdevelopment, and (iii) reducing the segment's new business model ishistorical ratio of capital expenditures to license more of its intellectual property and to increase royalty revenues over the next several years. Included in this initiative are patent cross-license and process technology licenses and agreements with partners to commercialize manufacturing invention and know-how the segment created in the course of conducting its business.
sales. Capital expenditures in the segment decreased 64% to $220 million, or 4.6% of segment net sales, in 2002, compared to $613 million, or 12.4% of segment net sales, in 2001. Both amounts represent significantly lower capital expenditure levels than in 2000 and earlier years.
Due to ongoing economic uncertainty, particularly in light of world events, it has become increasingly difficult to estimate the 2003 growth of the semiconductor industry markets served by the segment. Market analysts' estimates of 2003 market growth continue to vary widely, and now range from 0% to 22% growth. The segment expects its sales to increase at a rate that is comparable to industry growth in the markets it serves. The segment also expects improved operating results due to the expected increase in sales, the benefits of lower manufacturing expenses due to cost-reduction activities, and a significant decrease in reorganization of business and other charges.
Global Telecom Solutions Segment
The Global Telecom Solutions segment (GTSS) designs, manufactures, sells, installs, and services wireless infrastructure communication systems, including hardware and software. GTSS provides end-to-end wireless networks, including radio base stations, base site controllers, associated software and services, and third-party switching for Code Division Multiple Access (CDMA), Global System for Mobile Communications (GSM), iDEN® (integrated digital enhanced network), and Universal Mobile Telecommunications Systems (UMTS) technologies. In 2002, GTSS net sales represented 17% of the Company's consolidated net sales, compared to 22% in 2001 from $2.4and 20% in 2000.
| | Years Ended December 31 | Percent Change | |||||||||||
|---|---|---|---|---|---|---|---|---|---|---|---|---|---|
| (Dollars in millions) | 2002 | 2001 | 2000 | 2002 — 2001 | 2001 — 2000 | ||||||||
| Orders | $ | 4,313 | $ | 6,231 | $ | 7,559 | (31)% | (18)% | |||||
| Segment net sales | 4,540 | 6,442 | 7,597 | (30)% | (15)% | ||||||||
| Operating earnings (loss) | (621 | ) | (1,409 | ) | 812 | 56% | *** | ||||||
MANAGEMENT'S DISCUSSION AND ANALYSIS OF FINANCIAL CONDITION AND RESULTS OF OPERATIONS F-21
In 2002, segment net sales decreased 30% to $4.5 billion, compared to $6.4 billion in 2000.2001. Orders decreased 31% to $4.3 billion, compared to $6.2 billion in 2001. Sales and orders were significantly lower in 2002, compared to 2001 in each of the segment's technologies and in all regions of the world. The reduced expendituressegment's backlog was $1.2 billion at December 31, 2002, compared to $1.5 billion at December 31, 2001.
The wireless infrastructure industry experienced its most challenging years during 2001 and 2002. Industry sales were down approximately 18% in response2002, compared to flat growth in 2001. Service providers spent less on new equipment because of the difficult economic environment, severe pressure to reduce costs, deteriorating voice average revenue per user, and, for many, higher debt burdens. The segment's decline in sales and orders was indicative of conditions in the segment's industry, but represents a greater decline than the overall industry due to the overcapacity createdlower level of capital spending specific to the segment's customer base.
The nature of the segment's business is long-term contracts with major operators that require sizeable investments, often in excess of $100 million, by its customers. In 2002, three customers—Nextel Communications Inc. (and its affiliates), KDDI, a service provider in Japan, and China Unicom—represented approximately 43% of the segment's sales. The loss of a major customer could have a significant impact on the segment's business and, because contracts are long-term, would impact revenue over several quarters.
The segment's operating loss in 2002 was $621 million, compared to an operating loss of $1.4 billion in 2001. The improvement in operating results was primarily related to: (i) a decrease in reorganization of business and other charges, (ii) a decrease in SG&A expenses, and (iii) a decrease in R&D expenses, partially offset by the downturndecrease in sales. The Company records royalty income as an offset to SG&A expenses. Royalty income for the semiconductor industry. The segment's capital expendituressegment was $71 million in 2002 and $72 million in 2001.
For the full year 2002, GTSS recorded net charges of $610 million related to the reorganization of its business and other charges. These charges primarily related to: (i) a $401 million charge for the segment's share of a potentially uncollectible finance receivable from Telsim, (ii) a $128 million net charge for segment-wide employee severance costs, and (iii) a $55 million charge for exit costs related to a lease cancellation.
For the full year 2001, GTSS recorded net charges of $1.4 billion related to the reorganization of its business and other charges. These charges primarily related to: (i) a $1.1 billion charge for the segment's share of a potentially uncollectible finance receivable from Telsim, (ii) a $155 million net charge for segment-wide employee severance costs, (iii) a $123 million net charge for exit costs, and (iv) a $42 million net charge for fixed asset impairments.
The wireless infrastructure industry's migration to third-generation (3G) systems, which are high-capacity wireless networks designed to provide enhanced data services, improved Internet access and increased voice capacity, continues to progress slowly. Network operators are continuing to "slow-roll" or postpone the build-out of 3G Universal Mobile Telecommunications Systems (UMTS) systems, primarily because of: (i) funding constraints due to the very substantial fees network operators paid for 3G licenses; (ii) implementation issues associated with the introduction of this very complex new technology; (iii) limited development of new data applications; and (iv) limited handset availability. As a result of the slow migration to 3G, service providers are expected to be significantlycontinue to use General Packet Radio Service (GPRS), a 2.5G technology, to grow their data subscriber base and to build their business case for 3G systems. Operators are also giving serious consideration to deployment of EDGE technology, which is a Global System for Mobile Communications (GSM)-derivative technology that provides data bandwidths higher than GPRS in the existing GSM spectrum assignments.
GTSS is executing a strategy to enhance its position as a total systems supplier, primarily through developing strategic alliances with key vendors to supply a complete family of network products. One of the most significant alliances is the recently-announced agreement to supply a Motorola branded softswitch, which GTSS believes will position it as a leader in the evolution to next-generation IP networks. GTSS is also seeking to enhance its network products and revenues with a portfolio of services that reduce operator capital expenditure requirements, increase network capacity and improve system quality. These quality improvements benefit operators through increased customer satisfaction, greater usage and lower than thosechurn, all of which can have a positive impact on operator revenue. This total systems solution strategy represents an improved value proposition to operators and improves GTSS's competitive position in the marketplace.
In 2003, the segment expects wireless infrastructure industry sales to decline between 6% and 12% due to continued reductions in capital expenditures by wireless service providers in all regions of the world. The segment expects its 2003 sales to decrease at a rate that is comparable to the industry decline. The segment also expects an improvement in operating results due to a decrease in SG&A and R&D expenditures, as well as a significant decrease in reorganization of business and other charges.
F-22 MANAGEMENT'S DISCUSSION AND ANALYSIS OF FINANCIAL CONDITION AND RESULTS OF OPERATIONS
Commercial, Government and Industrial Solutions Segment
The Commercial, Government and Industrial Solutions segment (CGISS) designs, manufactures, sells, installs, and services analog and digital two-way radio voice and data products and systems to a wide range of public-safety, government, utility, transportation and other worldwide markets. In addition, CGISS participates in the emerging market of integrated information solutions for public-safety and enterprise customers. In 2002, CGISS net sales represented 14% of the Company's consolidated net sales, compared to 14% in 2001 based uponand 12% in 2000.
| | Years Ended December 31 | Percent Change | |||||||||||
|---|---|---|---|---|---|---|---|---|---|---|---|---|---|
| (Dollars in millions) | 2002 | 2001 | 2000 | 2002 — 2001 | 2001 — 2000 | ||||||||
| Orders | $ | 3,789 | $ | 4,469 | $ | 4,947 | (15)% | (10)% | |||||
| Segment net sales | 3,729 | 4,306 | 4,561 | (13)% | (6)% | ||||||||
| Operating earnings | 313 | 52 | 443 | *** | (88)% | ||||||||
In 2002, segment net sales decreased 13% to $3.7 billion, compared to $4.3 billion in 2001. Orders decreased 15% to $3.8 billion, compared to $4.5 billion in 2001. These decreases are primarily attributed to the sale of the Company's current estimateformer Integrated Information Systems Group (IISG) in 2001. In addition, delays in Federal, state and local government funding for new homeland security projects have adversely impacted sales for the total industry and CGISS.
During 2001, the Company sold IISG, its former defense and government electronics business, which was included in the CGISS segment. Orders, sales and operating earnings for IISG in 2001 were $499 million, $456 million and $45 million, respectively. Orders, sales and operating earnings for IISG in 2000 were $754 million, $572 million and $37 million, respectively. Excluding the full year 2001 IISG net sales and order results, 2002 net sales would have decreased 3% from $3.9 billion and 2002 orders would have decreased 5% from $4.0 billion. The segment's backlog was $1.7 billion at both December 31, 2002 and 2001.
On a geographic basis, $2.4 billion, or 65%, of the segment's 2002 industrynet sales growth.were in North America (which is part of the Americas region referenced below), as compared to $3.0 billion, or 69%, in 2001. Orders in North America were $2.6 billion in 2002, as compared to $3.1 billion in 2001.
2002 orders, as compared to 2001, were down 3% in Asia, down 8% in Europe and down 18% in the Americas. Sales were up 8% in Europe and down 17% in both the Americas and Asia. The Company does not anticipate a need for a significant increasemajority of IISG's sales and orders were in SPS manufacturing capacity.
the Americas. Excluding the impact of net special items fromIISG, sales and orders would have both years,been down 3% in the segment had a loss before income taxes of $1.2 billion in 2001 compared withAmericas.
The segment's operating earnings before income taxes of $677increased to $313 million in 2000.2002, compared to operating earnings of $52 million in 2001. The increase in operating earnings was primarily related to: (i) a decrease in profitability resulted from the significant reductionreorganization of business and other charges, (ii) an increase in sales discussed above,gross margin, and (iii) a decrease in SG&A costs, partially offset by initial benefitsthe decline in sales. Excluding the full year 2001 IISG operating results, operating earnings would have been $7 million in 2001.
For the full year 2002, CGISS recorded net charges of $48 million related to the reorganization of its business and other charges. These charges primarily related to segment-wide employee separation costs.
For the full year 2001, CGISS recorded net charges of $343 million related to the reorganization of its business and other charges. These charges primarily related to: (i) a $97 million net charge for segment-wide employee severance costs, (ii) an $88 million charge for a potentially uncollectible finance receivable, (iii) a $45 million net charge for exit costs, and (iv) a $36 million net charge for fixed asset impairments.
CGISS's performance will continue to be impacted by: (i) the heightened need for safety and security solutions worldwide; (ii) the formation of the U.S. Homeland Security Department in 2002; and (iii) demand for larger, more complex systems. While there is a heightened need for safety and security systems, the worldwide economic slowdown has created budget deficits at the local level, which has slowed government spending globally. In the U.S., many local governments continue to await funding from the cost-reduction actions taken during 2001.Federal government to help fund local homeland security programs. Although the recent formation of the U.S. Homeland Security Department is expected to provide more clarity over time regarding funding of safety and security programs, its creation creates new challenges in dealing with a new government agency made up of many smaller agencies. Finally, as the demand for larger, more complex systems continues, CGISS will face new challenges in meeting its customers' demands.
Semiconductor industry growth for 2002 remains difficult to forecast, however the Company currently anticipatesTwo-way radio industry sales growth of 5% to 10%, with sequential improvement expected in each quarter of 2002. SPS's sales in 2002 are expected2003 is forecasted to be higher thanbetween 2% and 8%, as homeland security programs are established at Federal, state and local levels in 2001 as a result of the anticipated industry-wide sales growth. The quarterly pattern should reflect sequential growth that should mirrorU.S. and other countries. For the sequential decline we experienced in 2001. Thefull year 2003 compared to the full year 2002, the segment expects losses to be loweran increase in 2002 than in 2001, largelysales and improved operating earnings due to decreased special charges and a favorable impact from the reorganization of businesses programs implemented throughout 2001.expected increase in sales.
MANAGEMENT'S DISCUSSION AND ANALYSIS OF FINANCIAL CONDITION AND RESULTS OF OPERATIONS F-27F-23
Broadband Communications Segment
The Broadband Communications segment (BCS) designs, manufactures and sells a wide variety of broadband products for the cable television industry, including: (i) digital systems and set-top terminals for cable television networks; (ii) high speed data products, including cable modems and cable modem termination systems (CMTS), as well as Internet Protocol (IP)-based telephony products; (iii) hybrid fiber coaxial network transmission systems used by cable television operators; (iv) digital satellite television systems for programmers; (v) direct-to-home (DTH) satellite networks and private networks for business communications; and (vi) digital broadcast products for the cable and broadcast industries. In 2002, BCS net sales represented 8% of the Company's consolidated net sales, compared to 10% in 2001 and 9% in 2000.
| | Years Ended December 31 | Percent Change | |||||||||||
|---|---|---|---|---|---|---|---|---|---|---|---|---|---|
| (Dollars in millions) | 2002 | 2001 | 2000 | 2002 — 2001 | 2001 — 2000 | ||||||||
| Orders | $ | 1,695 | $ | 2,837 | $ | 3,791 | (40)% | (25)% | |||||
| Segment net sales | 2,087 | 2,854 | 3,416 | (27)% | (16)% | ||||||||
| Operating earnings (loss) | (150 | ) | 195 | 367 | *** | (47)% | |||||||
In 2002, segment net sales declined 27% to $2.1 billion, compared to $2.9 billion in 2001. Orders declined 40% to $1.7 billion, compared to $2.8 billion in 2001. The decline in sales and orders is indicative of the difficult conditions in the segment's industry. In addition, the reduction in orders reflects a shorter cycle time required for customer fulfillment. The segment's backlog was $324 million at December 31, 2002, compared to $716 million at December 31, 2001.
Demand for the segment's products depends primarily on: (i) capital spending by providers of cable services for constructing, rebuilding or upgrading their communications systems, and (ii) the marketing of advanced communications services by those providers. After many years of solid growth, in 2002 the cable equipment industry faced a second consecutive year of sales declines. The difficult economic environment continued to impact cable service providers, who have seen declines in net digital subscriber additions. The providers have responded by reducing capital spending in order to lower their cost structure, improve cash flow and reduce their significant debt levels. This is reflected in lower purchases of digital set-top terminals, as well as a reduction in purchases of network transmission systems and equipment. The industry also experienced a reduction in average selling prices (ASPs) for cable modems.
On a geographic basis, $1.8 billion, or 85%, of the segment's net sales were in North America in 2002, compared to $2.3 billion, or 81%, in 2001. Orders in the North America region were $1.4 billion in 2002, compared to $2.3 billion in 2001. Of the $767 million decline in net sales in 2002, the majority related to the decline in sales in North America of digital set-top box units.
In 2002, sales of digital set-top boxes decreased to $1.2 billion, compared to $1.6 billion in 2001. Digital set-top box unit shipments were 5.5 million in 2002, down 24% from 7.2 million units in 2001. ASPs for digital set-top boxes declined approximately 4% in 2002. The decline in unit shipments is consistent with the overall decline in the set-top box industry, and the segment retained its leading market share.
In 2002, sales of cable modems decreased to $235 million, compared to $365 million in 2001. Cable modem unit shipments were 3.5 million in 2002, up 9% from 3.2 million units in 2001. ASPs for cable modems decreased approximately 40% in 2002, due to increased competition in low-end cable modems.
BCS is dependent upon a small number of customers for a significant portion of its sales. A small number of large cable television multiple system operators (MSO) own a large portion of the cable systems and account for a significant portion of the total capital spending in the cable equipment industry. Consolidation of these MSO's continued in 2002, with Comcast Corporation acquiring AT&T Broadband to form the largest MSO in North America. The segment's combined sales to Comcast and AT&T Broadband in 2002 represented approximately 40% of segment net sales.
The segment incurred an operating loss in 2002 of $150 million, compared to operating earnings of $195 million in 2001. The decline in operating results was primarily related to: (i) an intangible asset impairment charge relating to a license to certain intellectual property that enables BCS to provide national authorization services for digital set-top terminals, (ii) the decline in sales, and (iii) an increase in warranty expenditures due to a product recall, partially offset by: (i) manufacturing cost reductions, including supply-chain savings, resulting in a higher gross margin as a percent of sales, (ii) a decrease in R&D and SG&A expenditures, and (iii) a decrease in other overhead costs resulting from the segment's facility consolidations and other cost-containment actions.
For the full year 2002, BCS recorded net charges of $407 million related to the reorganization of its business and other charges. These charges primarily related to: (i) a $325 million charge for an intangible asset impairment of an intellectual property license, (ii) a $37 million net charge for segment-wide employee separation costs, and (iii) an
F-24 MANAGEMENT'S DISCUSSION AND ANALYSIS OF FINANCIAL CONDITION AND RESULTS OF OPERATIONS
$11 million charge for in-process research and development related to the acquisition of Synchronous, Inc., partially offset by the recognition of a pension curtailment gain of $13 million related to the General Instrument pension plan.
For the full year 2001, BCS recorded net charges of $255 million related to the reorganization of its business and other charges. These charges primarily related to: (i) a $53 million net charge for segment-wide employee separation costs, (ii) a $51 million charge for product portfolio simplification write-offs, (iii) $42 million in charges for exit costs and fixed asset impairments, (iv) a $33 million litigation settlement charge, and (v) a $20 million charge for in-process research and development related to the acquisition of RiverDelta Networks Inc.
Over the next several years, BCS expects more competition for its cable products as a result of regulatory and customer-driven changes. In 2003, the primary impact will result from BCS licensing some of its technology to several competitors in response to customer requirements.
For the full year 2003, compared to the full year 2002, the segment expects broadband equipment industry sales to decline approximately 10% to 15%, due to continued lower capital expenditures by cable operators. The segment expects its sales in 2003 to decrease at a rate that is comparable to the industry decline. The segment expects to improve operating results due to a significant decrease in reorganization of business and other charges.
Integrated Electronic Systems Segment
| | Years ended December 31 | |||||||||
|---|---|---|---|---|---|---|---|---|---|---|
| ($ in millions) | 2001 | 2000 | 1999 | |||||||
| Orders | $ | 2,094 | $ | 2,920 | $ | 2,654 | ||||
| % change from prior year | -28% | 10% | 18% | |||||||
| Segment sales | $ | 2,239 | $ | 2,869 | $ | 2,592 | ||||
| % change from prior year | -22% | 11% | 17% | |||||||
| Earnings (loss) before income taxes | $ | (211 | ) | $ | 184 | $ | 192 | |||
| % change from prior year | -215% | -4% | 24% | |||||||
| Special items: income (charge) | ||||||||||
| Reorganization of businesses | $ | (141 | ) | $ | (43 | ) | $ | — | ||
| Gain (loss) on sale of investments/businesses | — | 30 | 6 | |||||||
| Other | (38 | ) | (12 | ) | (5 | ) | ||||
| Net special items | $ | (179 | ) | $ | (25 | ) | $ | 1 | ||
| Earnings (loss) before income taxes excluding special items | $ | (32 | ) | $ | 209 | $ | 191 | |||
| % change from prior year | -115% | 9% | 19% | |||||||
The Integrated Electronic Systems segment (IESS) designs, manufactures and sellssells: (i) automotive and industrial electronics systems and solutions, (ii) telematics products and solutions, (iii) portable energy storage products and systems, and (iv) multi-function embedded board and computer system products. In 2002, IESS net sales represented 8% of the Company's consolidated net sales, compared to 7% in 2001 and 8% in 2000.
| | Years Ended December 31 | Percent Change | |||||||||||
|---|---|---|---|---|---|---|---|---|---|---|---|---|---|
| (Dollars in millions) | 2002 | 2001 | 2000 | 2002 — 2001 | 2001 — 2000 | ||||||||
| Orders | $ | 2,236 | $ | 2,094 | $ | 2,920 | 7% | (28)% | |||||
| Segment net sales | 2,189 | 2,239 | 2,869 | (2)% | (22)% | ||||||||
| Operating earnings (loss) | 52 | (171 | ) | 168 | *** | *** | |||||||
In 2001,2002, segment net sales decreased 22% from $2.92% to $2.19 billion, compared to $2.24 billion in 2001. Orders increased 7% to $2.2 billion, compared to $2.1 billion in 2001.
There are three primary business groups within the IESS segment: (i) the Automotive Communications and Electronic Systems Group (ACES), (ii) the Motorola Computer Group (MCG), and (iii) the Energy Systems Group (ESG). In 2002, ACES, MCG and ESG represented 60%, 12% and 28% of the segment's net sales, respectively. In 2001, ACES, MCG, and ESG represented 50%, 21% and 29% of the segment's net sales, respectively. The segment's backlog was $308 million at December 31, 2002, compared to $261 million at December 31, 2001.
Comparing 2002 to 2001, ACES' sales were up 18% and orders were up 24%, primarily due to: (i) the success of several new products launched during the year, (ii) the addition of new features on existing products, and (iii) increased usage of its products in automobile production. MCG's 2002 sales decreased 45% and orders decreased 28% to $2.1 billion. Automotive and industrial electronics systems sales decreased primarily27%, due to a decrease in vehicle production in the U.S. and Europe. Energy storage products sales decreased due to a decrease in average selling prices and a downturn in wireless telephone industry sales. Sales of multi-function embedded board and computer system products decreased very significantly due to a severecontinuing downturn in the computer systemstelecommunications equipment industry, its primary market. ESG's 2002 sales decreased 5% and orders decreased 1%.
A large part of the IESS's business is dependent upon other Motorola businesses, primarily the Personal Communications segment, and three external automotive manufacturers. IESS sold 63% of its products equipment industry.to four customers—19% to other Motorola businesses, 16% to General Motors, 14% to Ford and 14% to Daimler Chrysler.
The segment incurred a loss before income taxesreported operating earnings of $211$52 million in 2002, compared to earnings before income taxesan operating loss of $184$171 million in 2001. The improvement in operating results was primarily related to: (i) benefits from cost-reduction activities, reflected in lower manufacturing costs and lower SG&A costs, and (ii) a year earlier. The declinedecrease in financial performance was due to lower sales and an increase in net special charges compared to 2000. The 2001 loss includes $179 million of net special charges, comprised primarily of $141 million of charges for reorganization of businesses, primarily related to employee separation charges, exit costsbusiness and asset writedowns. The net special charges of $25 million in 2000 were comprised primarily of $43 million for reorganization of businessesother charges, partially offset by $30 million of gains from the sale of investments and businesses.decline in sales.
During 2001, IESS2002, the segment continued implementing major cost-reduction actions intended to improve its cost structure, refocus its long-term strategies and improve the competitivenesscompetitiveness. In 2002, IESS recorded net charges of the segment. The segment moved production from Dublin, Ireland; Harvard, Illinois, and Lawrenceville, Georgia$63 million related to Nogales, Mexico; Penang, Malaysia, and Tianjin, China. As a result, IESS stopped manufacturing at each of these three manufacturing facilities. IESS is also in the process of moving auto body production from Elma, New York to Nogales, Mexico. As a result, it has significantly downsized the Elma manufacturing facility. Based upon a reassessment of the segment's cost structure, IESS exited the facility in Stotfold, UK and is in the process of establishing a regional automotive headquarters in Munich, Germany.
IESS exited several businesses to realign its long-term business strategies. As a result, the segment consolidated and closed several sales, distribution and administration facilities. In addition, IESS has reduced the number of its employees by 21% since the end of 2000.
Excluding the impact of net special charges from both years, the segment incurred a loss before income taxes of $32 million in 2001 compared to earnings before income taxes of $209 million in 2000. The decrease in earnings is primarily due to lower sales.
2002 segment sales are expected to be lower than in 2001, primarily due to an expected further decline in sales of multi-function embedded board and computer system products. These products are sold to the telecommunications equipment industry, which continues to be adversely affected by declining capital expenditures by telecommunications service providers. Despite lower anticipated sales, the segment expects to be profitable in 2002 due to a favorable impact from the reorganization of businesses programs implemented throughout 2001.its business and other charges. These charges primarily related to: (i) $24 million in net charges for exit costs, (ii) $23 million in net charges for fixed asset impairments, and (iii) $20 million in net charges for segment-wide employee separation costs.
A significant portion of the segment's business is dependent upon other Motorola businesses and three external customers. In 2001, 52%IESS recorded net charges of IESS's sales came from four customers: Motorola internal businesses, 25%; Ford (including Jaguar), 10%; Daimler-Chrysler, 9%;$159 million related to the reorganization of its business and GM (including OnStar), 8%. Each of these key customers is served by more than one group within the segment and with multiple product offerings within the groups. The loss of a significant portion of these customers' business could have a material adverse effect upon the segment.other charges. These charges primarily related to: (i) $103 million in net charges for segment-wide employee separation costs,
F-28 MANAGEMENT'S DISCUSSION AND ANALYSIS OF FINANCIAL CONDITION AND RESULTS OF OPERATIONS F-25
(ii) a $20 million charge for in-process research and development relating to the acquisition of Blue Wave Systems, Inc., (iii) $19 million in net charges for fixed asset impairments, and (iv) $18 million in net charges for exit costs. Demand for For the full year 2003 compared to the full year 2002, the segment the segment's automotiveACES products is strongly linked to automobile sales in the United StatesU.S. and other countries.countries and the level of electronic content per vehicle. Demand for portable energy storageESG products is strongly linked to the sales of other Motorola businesses, particularly the sales of the Personal Communications segment. Demand for MCG products is linked to sales of telecommunications, manufacturing, and other industry segments within Motorola. Demand for multi-function embedded board and computer system products is linked to demand for manufacturinginfrastructure systems imaging, and telecommunications products in the United StatesU.S. and other countries. The challenging economic environment has negatively affected each of these end markets. Recovery in the markets served by IESS's customers will be an important component of IESS's future performance.experiences competition from numerous global competitors, including automobile manufacturers' internal or affiliated electronic control suppliers.
Other
| | Years ended December 31 | ||||||||||
|---|---|---|---|---|---|---|---|---|---|---|---|
| ($ in millions) | 2001 | 2000 | 1999 | ||||||||
| Segment sales | $ | 755 | $ | 1,057 | $ | 804 | |||||
| % change from prior year | (29% | ) | 31% | (34% | ) | ||||||
| Loss before income taxes | $ | (256 | ) | $ | (253 | ) | $ | (556 | ) | ||
| % change from prior year | (1% | ) | 54% | (51% | ) | ||||||
| Special items: income (charge) | |||||||||||
| Gain on sale of investments/businesses | $ | 1,315 | $ | 570 | $ | 526 | |||||
| Investment impairments | (351 | ) | — | — | |||||||
| Reorganization of businesses | (234 | ) | (115 | ) | 47 | ||||||
| Goodwill impairment | (81 | ) | — | — | |||||||
| Amortization of goodwill | (19 | ) | (55 | ) | (57 | ) | |||||
| General Instrument merger integration costs | — | (98 | ) | — | |||||||
| Iridium related | (365 | ) | — | (552 | ) | ||||||
| In-process research and development | — | (80 | ) | — | |||||||
| Other | (106 | ) | (12 | ) | (101 | ) | |||||
| Net special items | $ | 159 | $ | 210 | $ | (137 | ) | ||||
| Loss before income taxes, excluding special items | $ | (415 | ) | $ | (463 | ) | $ | (419 | ) | ||
| % change from prior year | 10% | (11% | ) | 41% | |||||||
Other is comprised of the Other Products segment and general corporate items. The Other Products segment includes: (i) various corporate programs representing developmental businesses and research and development projects; (ii) the Company's holdings in cellular operating companies outside the U.S.; (iii) the Internet Software and Content Group, which provides end-to-end application services to the Company's segments, and (iv) Next Level Communications, Inc., a publicly-traded subsidiary in which the Company has a controlling interest.
Other sales were down 29% to $755 million compared to $1.1 billion a year ago. The decreaseinterest, (ii) various corporate programs representing developmental businesses and research and development projects, which are not included in sales is due primarily to the disposition ofany major segment, and (iii) the Company's holdings in cellular operating companies outside the U.S.
| | Years Ended December 31 | Percent Change | |||||||||||
|---|---|---|---|---|---|---|---|---|---|---|---|---|---|
| (Dollars in millions) | 2002 | 2001 | 2000 | 2002 — 2001 | 2001 — 2000 | ||||||||
| Segment net sales | $ | 486 | $ | 755 | $ | 1,057 | (36)% | (29)% | |||||
| Operating loss | (419 | ) | (1,210 | ) | (699 | ) | 65% | (73)% | |||||
In 2002, Other Products segment net sales decreased 36% to $486 million, compared to $755 million in 2001. The decrease in sales is primarily attributed to the sale of several cellular operating companies outside the U.S. and the sale of the Company's former Multiservice Networks Division (MND) in 2001.
The Company sold MND, a provider of end-to-end managed network solutions, which was included in the Other Products segment in 2001. Sales and general corporate items generated athe operating loss before income taxesfor MND in 2001 were approximately $97 million and $16 million, respectively.
The segment incurred an operating loss of $256$419 million in 20012002, compared to aan operating loss of $253$1.2 billion in 2001. The decrease in the operating loss was primarily related to a decrease in reorganization of business and other charges, and the benefits from cost-reduction activities.
For the full year 2002, the segment recorded net charges of $36 million related to the reorganization of its businesses and other charges. These net charges primarily consist of: (i) $56 million in 2000. The lossnet charges for fixed asset impairments, (ii) $46 million in net charges for segment-wide employee separation costs, and (iii) $16 million in net charges for exit costs, partially offset by: (i) income of $63 million for Iridium vendor termination settlements and the related reduction of accruals no longer needed, and (ii) income of $24 million for the reduction of accruals no longer needed due to the settlement of certain environmental claims.
For the full year 2001, includes $159the segment recorded net charges of $804 million of income from net special items, including $1.3 billion of gains from sales of investments and businesses, primarily fromrelated to the Company's salereorganization of its investments in cellular operating companies outside the U.S., offset by $1.2 billion of specialbusinesses and other charges. These charges comprised primarily of:related to: (i) a $365 million charge related to an unfavorable court ruling in litigation involving the company's guarantee of a credit agreement for Iridium LLC;LLC, (ii) $351$116 million in net charges for segment-wide employee separation costs, (iii) an $81 million charge for goodwill impairments, primarily related to the Internet Software and Content Group, (iv) a $77 million charge for segment-wide exit costs, (v) a $50 million charge relating to potentially uncollectible finance receivables, and (vi) a $29 million net charge for fixed asset impairments.
At December 31, 2002, the Company and General Instrument Corporation, a wholly-owned subsidiary of the Company, owned 74% of the outstanding common stock of Next Level Communications, Inc. (Next Level), a publicly-traded subsidiary, which is consolidated in Motorola's financial statements. In addition, the Company owns all of the preferred stock of Next Level, which is convertible into common stock, and warrants to purchase common stock at various prices over various periods. Assuming the conversion of all preferred stock and the exercise of all warrants, Motorola beneficially owns approximately 90% of Next Level's common stock. Effective in the fourth quarter of 2001, the Company began to include in its consolidated results the minority interest share of Next Level's operating losses as a result of Next Level's cumulative net deficit equity position.
F-26 MANAGEMENT'S DISCUSSION AND ANALYSIS OF FINANCIAL CONDITION AND RESULTS OF OPERATIONS
In January of 2003, the Company initiated a tender offer for the remaining outstanding publicly-held shares of Next Level that it does not own. The tender offer is still pending and is scheduled to expire on April 11, 2003.
Significant Accounting Policies
Management's Discussion and Analysis of Financial Condition and Results of Operations discusses the Company's consolidated financial statements, which have been prepared in accordance with accounting principles generally accepted in the United States of America. The preparation of these financial statements requires management to make estimates and assumptions that affect the reported amounts of assets and liabilities and the disclosure of contingent assets and liabilities at the date of the financial statements, as well as the reported amounts of revenues and expenses during the reporting period.
Management bases its estimates and judgments on historical experience, current economic and industry conditions and on various other factors that are believed to be reasonable under the circumstances. This forms the basis for making judgments about the carrying values of assets and liabilities that are not readily apparent from other sources. Actual results may differ from these estimates under different assumptions or conditions. Management believes the following critical accounting policies require significant judgment and estimates:
Valuation of Investments and Long-Lived Assets
The Company assesses the impairment of investments and long-lived assets, which includes identifiable intangible assets, goodwill and property, plant and equipment, whenever events or changes in circumstances indicate that the carrying value may not be recoverable. Factors considered important which could trigger an impairment review include: (i) underperformance relative to expected historical or projected future operating results; (ii) changes in the manner of use of the assets or the strategy for our overall business; (iii) negative industry or economic trends; (iv) declines in stock price of an investment portfolio; (iii) $234for a sustained period; and (v) our market capitalization relative to net book value.
When the Company determines that the carrying value of intangible assets, goodwill and long-lived assets may not be recoverable, an impairment charge is recorded. Impairment is generally measured based on a projected discounted cash flow method using a discount rate determined by our management to be commensurate with the risk inherent in our current business model or prevailing market rates of investment securities, if available.
At December 31, 2002 and 2001, the net book values of these assets were as follows (in millions):
| December 31 | 2002 | 2001 | ||||
|---|---|---|---|---|---|---|
| Property, plant and equipment | $ | 6,104 | $ | 8,913 | ||
| Investments | 2,053 | 2,954 | ||||
| Intangible assets | 232 | 555 | ||||
| Goodwill | 1,375 | 1,184 | ||||
| Total | $ | 9,764 | $ | 13,606 | ||
Beginning in late 2000 and continuing through 2002, as a result of the Company's initiatives to consolidate operations and exit businesses, impairment reviews were performed. Based upon these reviews, management determined that various long-lived and intangible assets had been impaired. The Company recorded fixed asset impairment charges of $1.4 billion in 2002 and $847 million in 2001. The 2002 charges primarily related to manufacturing facilities in the Semiconductor Products segment, and the 2001 charges primarily related to manufacturing facilities in the Semiconductor Products segment and the Personal Communications segment.
As a result of the downturn of the worldwide economic environment and capital markets, the Company recorded impairment charges related to its investment portfolio of $1.3 billion and $1.2 billion in 2002 and 2001, respectively. These investments primarily represented investments in cable operating companies and in Nextel Communications, Inc. Additionally, the available-for-sale securities portfolio reflected a net pre-tax unrealized gain position of $954 million at December 31, 2002, compared to a net pre-tax unrealized gain position of $556 million at December 31, 2001.
In the second quarter of 2002, the Broadband Communications segment recorded an intangible asset impairment charge of $325 million relating to a license to certain intellectual property that enables the segment to provide national authorization services for reorganizationdigital set-top terminals. Historically, the segment has amortized this intangible asset based on an expected revenue stream. In the second quarter of 2002, it was determined that the future revenue stream would decline significantly due to an anticipated drop in the number of new subscribers utilizing the services provided under the license, caused primarily by the expected consolidations of cable operators, specifically the acquisition of AT&T Broadband by Comcast Corporation.
The Company adopted Statement of Financial Accounting Standards ("SFAS") No. 142, "Goodwill and Other Intangible Assets," on January 1, 2002. As a result, the
MANAGEMENT'S DISCUSSION AND ANALYSIS OF FINANCIAL CONDITION AND RESULTS OF OPERATIONS F-27
Company has ceased amortizing goodwill. No goodwill impairment charges were required upon transition to SFAS No. 142. Additionally, on October 1, 2002, the date of the annual impairment review, the Company determined that no goodwill impairment charges were required.
The Company cannot predict the occurrence of future impairment-triggering events nor the impact such events might have on these reported asset values. Such events may include strategic decisions made in response to the economic conditions relative to product lines, operations and the impact of the economic environment on our customer base.
Restructuring Activities
Beginning in 2000 and through 2002, the Company announced plans to reduce its workforce, discontinue product lines, exit businesses comprisedand consolidate manufacturing operations. The Company initiated these plans in an effort to reduce costs and simplify its product portfolio. Net restructuring charges under these plans have been approximately $2.3 billion during the period from 2000 through 2002, covering employee separation costs and exits costs based on estimates prepared at the time the restructuring plans were approved by management. Exit costs primarily consist of future minimum lease payments on vacated facilities and facility closure costs. Employee separation costs consist primarily of employee severance andpayments to terminated employees. At each reporting date, the Company evaluates its accruals for exit costs and (iv) $81employee separation to ensure that the accruals are still appropriate. In certain circumstances, accruals are no longer required because of efficiencies in carrying out the plans or because employees previously identified for separation resigned from the Company unexpectedly and did not receive severance or were redeployed due to circumstances not foreseen when the original plans were initiated. The Company reverses accruals to income when it is determined they are no longer required.
Allowance for Losses on Finance Receivables
The Company has historically provided financing to certain customers in connection with sizeable purchases of the Company's infrastructure equipment. Financing provided has included all or a portion of the equipment purchase price, as well as working capital for certain purchasers.
Gross financing receivables were $2.7 billion at December 31, 2002 and $2.8 billion at December 31, 2001, with an allowance for losses on these receivables of $2.3 billion and $1.6 billion, respectively. Of the receivables at December 31, 2002, $2.5 billion ($286 million, net of allowance for losses of $2.2 billion) were considered impaired based on management's determination that the Company will be unable to collect all amounts due according to the contractual terms of the relevant agreement. By comparison, impaired receivables at December 31, 2001 were $2.5 billion ($916 million, net of allowance for losses of $1.6 billion).
The Company recorded a $1.4 billion and $526 million charge in 2001 and 2002, respectively, relating to one customer, Telsim. Gross receivables from Telsim are $2.0 billion and were fully reserved as of December 31, 2002.
Management periodically reviews customer account activity in order to assess the adequacy of the allowances provided for potential losses. Factors considered include economic conditions, collateral values and each customer's payment history and credit worthiness. Adjustments, if any, are made to reserve balances following the completion of these reviews to reflect management's best estimate of potential losses. The resulting net finance receivable balance is intended to represent the estimated realizable value as determined based on the fair value of the underlying collateral, if the receivable is collateralized, or the present value of expected future cash flows discounted at the effective interest rate implicit in the underlying receivable.
Retirement-Related Benefits
The Company accounts for its pension benefits and its postretirement health care benefits using actuarial models required by SFAS No. 87, "Employers' Accounting for Pensions" and SFAS No. 106, "Employers' Accounting for Postretirement Benefits Other Than Pensions", respectively. These models use an attribution approach that generally spreads individual events over the service lives of the employees in the plan. Examples of "events" are plan amendments and changes in actuarial assumptions such as discount rate, expected long-term rate of return on plan assets, and rate of compensation increases. The principle underlying the required attribution approach is that employees render service over their service lives on a relatively consistent basis and, therefore, the income statement effects of pension benefits or postretirement health care benefits are earned in, and should be expensed in, the same pattern.
There are various assumptions used in calculating the net periodic benefit expense and related benefit obligations. One of these assumptions is the expected long-term rate of return on plan assets. The required use of expected long-term rate of return on plan assets may result in recognized pension income that is greater or less than the actual returns of those plan assets in any given year. Over time, however, the expected long-term returns are designed to approximate the actual long-term returns and therefore result in a pattern of income and expense recognition that more closely matches the pattern of the services provided by the employees. Differences between actual and expected returns are recognized in the net periodic pension calculation over five years.
The Company uses long-term historical actual return experience with consideration of the expected investment mix of the plans' assets, as well as future estimates of long-term investment returns to develop its expected rate of return assumption used in calculating the net periodic pension cost and the net retirement healthcare expense. The Company's investment return assumption for the Regular
F-28 MANAGEMENT'S DISCUSSION AND ANALYSIS OF FINANCIAL CONDITION AND RESULTS OF OPERATIONS
Pension Plan and Postretirement Health Care Benefits Plan was 8.50% in 2002 and 9.00% in 2001. The investment return assumption for the Officers' Pension Plan was 6.00% in 2002 and 2001.
A second key assumption is the discount rate. The discount rate assumptions used for pension benefits and postretirement health care benefits accounting reflects, at December 31 of each year, the prevailing market rates for high-quality, fixed-income debt instruments that, if the obligation was settled at the measurement date, would provide the necessary future cash flows to pay the benefit obligation when due. The Company's discount rate for obligations was 6.75% in 2002 and 7.25% in 2001.
A final set of assumptions involves the cost drivers of the underlying benefits. The rate of compensation increase is a key assumption used in the actuarial model for pension accounting and is determined by the Company based upon its long-term plans for such increases. In both 2002 and 2001, the Company's rate for future compensation increase was 4.00% for non-officer employees and 3.00% for officers. For retiree medical plan accounting, the Company reviews external data and its own historical trends for health care costs to determine the health care cost trend rates. Based on this review, the health care trend rate used to determine the December 31, 2002 accumulated postretirement benefit obligation was 12% for 2003 with a declining trend rate each year until it reaches 5% by 2017, with a flat 5% rate for 2017 and beyond.
Several years of negative financial market returns have resulted in a decline in the fair-market value of plan assets. This, when combined with declining discount rate assumptions in the last several years, has resulted in a decline in the funded status of many of the Company's domestic and certain non-U.S. plans. Consequently, the Company's accumulated benefit obligation for various plans exceeded the fair-market value of the plan assets for these plans at December 31, 2002. As required by SFAS No. 87, the Company recorded a non-cash, after-tax, net charge of $647 million to equity relating to the Regular Pension Plan, the Officers' Pension Plan, and certain non-U.S. subsidiaries retirement programs in the fourth quarter of 2002. This charge was included in Non-Owner Changes to Equity in the consolidated balance sheets, and did not impact the Company's pension expense, earnings or cash contribution requirements in 2002.
For the Regular Pension Plan, the Company currently estimates 2003 expenses will be approximately $125 million, as compared to an actual expense of $72 million for impairment2002 and an actual expense of goodwill.$129 million for 2001. The lossincrease in 2000 included $210 millionthe 2003 Regular Pension Plan expense compared to 2002 is due to: (i) assumption changes in the discount rate and the expected long-term rate of income from net special items, including $570 millionreturn, (ii) an increase in the overall service year benefits earned for the expected number of gains on sales of investmentsactive participants, and businesses,(iii) investment losses, partially offset by special charges, comprised primarily of: (i) $115 million for reorganizationthe result of businesses, (ii) $98 milliona decline in the number of General Instrument merger integration costs and (iii) $80 million for in-process research and development charges related toactive participants. In 2002, the acquisition of Clinical Micro Sensors, Inc.
Sales in 2002 are anticipated to be lower than in 2001 due to the sale of holdings in cellular operating companies and MND. The segment expects losses before income taxes to be lower in 2002Regular Pension Plan expense decreased compared to 2001 as a result of the decline in the number of active participants, as well as the impact of Plan design changes. No cash contribution to the Regular Pension Plan was required in 2002; however, the Company expects to make a cash contribution of between $150 million and $200 million to this plan during 2003.
For the Postretirement Health Care Benefits Plan, the Company currently estimates 2003 expenses will be approximately $50 million, as compared to an actual expense of $38 million in 2002 and $27 million in 2001. The increase is due primarily to a favorablerising health care costs. The Company has partially funded its accumulated benefit obligation of $771 million with Plan assets valued at $218 million at December 31, 2002. No cash contributions were required in 2002 or 2001; however, the Company is currently evaluating whether funding will resume in 2003.
The impact from reorganizationon the future financial results of businesses programs implemented throughout 2001.the Company in relation to retirement-related benefits is dependent on economic conditions, employee demographics and investment performance. The Company's measurement date of its plan assets and obligations is December 31. Thus, during the fourth quarter of each year, management reviews and, if necessary, adjusts the assumptions associated with its benefit plans.
Market Risk FactorsLong-Term Contract Accounting
Foreign Exchange Market Risk The Company applies the percentage-of-completion methodology as stated in Statement of Position 81-1 "Accounting for Performance of Construction-Type and Certain Production-Type Contracts" to recognize revenues on various long-term contracts involving proven technologies. These contracts primarily involve the design, engineering, manufacturing, and installation of wireless infrastructure communication systems by GTSS and two-way radio voice and data systems by CGISS. These systems are designed to meet specific customer specifications and typically require an extended period of time to construct.
See Note 1The Company executes contracts with customers that describe the equipment and system specifications to be delivered, including the consideration to be received. Revenue is recognized as work progresses on each contract and is based on the percentage of costs incurred to date compared to the Consolidated Financial Statementstotal estimated contract costs. Estimates of total contract costs and Notesprogress toward completion of each contract are prepared using estimates and judgments based on historical experience and on other factors believed to be relevant under the circumstances. Management regularly assesses normal, recurring business risks and uncertainties inherent in this appendix tothese customer contracts and considers the Proxy Statement for a descriptionimpact, if any, of these uncertainties in the preparation of contract estimates. These uncertainties may include system performance and implementation delays resulting from events both within and outside the control of the Company's currency translation and transaction accounting policies, and Note 4 for informationCompany. Losses on individual contracts, if any, are recognized during the period in which the loss first becomes evident.
MANAGEMENT'S DISCUSSION AND ANALYSIS OF FINANCIAL CONDITION AND RESULTS OF OPERATIONS F-29
about Changes in these estimates could negatively impact the Company's operating results. In addition, unforeseen conditions could arise over the contract term that may have a significant impact on the operating results. It is reasonably likely that different operating results would be reported if the Company used other acceptable revenue recognition methodologies, such as the completed-contract method, or applied different assumptions.
Deferred Tax Asset Valuation
The Company recognizes deferred tax assets and liabilities based on the differences between the financial statement carrying amounts and the tax bases of assets and liabilities. The Company regularly reviews its deferred tax assets for recoverability and establishes a valuation allowance based on historical taxable income, projected future taxable income, the expected timing of the reversals of existing temporary differences and the implementation of tax-planning strategies. If the Company continues to operate at a loss or is unable to generate sufficient future taxable income, or if there is a material change in the actual effective tax rates or time period within which the underlying temporary differences become taxable or deductible, the Company could be required to increase its valuation allowance against its deferred tax assets resulting in an increase in its effective tax rate and an adverse impact on operating results.
At December 31, 2002 and 2001, the Company's deferred tax assets related to U.S. tax carryforwards were $756 million and $1.8 billion, respectively, a majority of which are foreign tax credits that may be carried forward until 2005 and 2006. Due to the significant foreign cash repatriations made during 2002, the Company was able to utilize a significant portion of its foreign tax credit carryforwards. The remaining U.S. tax carryforwards are comprised of net operating loss carryforwards and research and experimental credits which expire over periods ranging from five to twenty years and alternative minimum tax credits that can be carried forward indefinitely.
The deferred tax asset for U.S. tax carryforwards is determined to be realizable based on management's estimates of future taxable income and the implementation of certain tax-planning strategies. As a result, no valuation allowance has been provided. Should the Company fail to generate enough taxable income in future years, a portion of the tax carryforwards could expire unused, which would cause an increase in the Company's effective tax rate. In addition, certain non-U.S. subsidiaries, primarily in Germany, Japan and the UK, have generated tax loss carryforwards resulting in gross deferred tax assets of $575 million at December 31, 2002. Due to the uncertainty in these countries as to the realizability of these amounts, management has provided a valuation allowance of $512 million at December 31, 2002, resulting in net non-U.S. subsidiary deferred tax assets of $243 million.
Inventory Valuation Reserves
The Company records valuation reserves on its inventory for estimated obsolescence or unmarketability. The amount of the reserve is equal to the difference between the cost of the inventory and the estimated market value based upon assumptions about future demand and market conditions. On a quarterly basis, management in each segment performs an analysis of the underlying inventory to identify reserves needed for excess and obsolescence and for the remaining inventory assesses the net realizable value. Management uses its best judgment to estimate appropriate reserves based on this analysis.
In addition to normal excess and obsolescence provisions for inventory, in 2001 the Company recorded $583 million in inventory write-down charges for product portfolio simplifications primarily in the Personal Communications segment attributable to accelerated erosion of average selling prices for analog and first-generation digital wireless telephones.
Net Inventories consisted of the following:
| December 31 | 2002 | 2001 | |||||
|---|---|---|---|---|---|---|---|
| Finished goods | $ | 1,131 | $ | 1,140 | |||
| Work-in-process and production materials | 2,742 | 2,782 | |||||
| 3,873 | 3,922 | ||||||
| Less inventory reserves | (1,004 | ) | (1,166 | ) | |||
| $ | 2,869 | $ | 2,756 | ||||
The Company balances the need to maintain strategic inventory levels to ensure competitive delivery performance to its customers with the risk of inventory obsolescence due to rapidly changing technology and customer requirements. As indicated above, the Company's inventory reserves represented 26% and 30% of the gross inventory balance at December 31, 2002 and 2001, respectively. These reserve levels are maintained by the Company to provide for unique circumstances facing our businesses. The Company has inventory reserves for pending cancellations of product lines due to technology changes, long-life cycle products, lifetime buys at the end of supplier production runs, business exits, and a shift of production to outsourcing.
The decline in the reserve balance in 2002 compared to 2001 primarily relates to scrapping of excess and obsolete inventory with the appropriate reduction in the related gross inventory balance. If actual future demand or market conditions are less favorable than those projected by management, additional inventory writedowns may be required. Likewise, as with other reserves based on management's judgment, if the reserve is no longer needed, amounts are reversed into income. There were no significant reversals into income of this type in 2002.
F-30 MANAGEMENT'S DISCUSSION AND ANALYSIS OF FINANCIAL CONDITION AND RESULTS OF OPERATIONS
Recent Accounting Pronouncements
In July 2002, the FASB issued Statement No. 146, "Accounting for Costs Associated with Exit or Disposal Activities". Statement 146 no longer permits the accrual of exit costs at the date management approves a plan. Rather, with the exception of certain employee terminations carried out within 60 days of a plan approval, exit costs (including employee separation costs) will be recognized as they are incurred. Statement 146 is effective for exit plans initiated after December 31, 2002. Statement 146 does not change the accounting for the Company's restructuring activities initiated prior to 2003.
In November 2002, the FASB published Interpretation No. 45, "Guarantor's Accounting and Disclosure requirements for Guarantees, Including Indirect Guarantees of Indebtedness of Others". The interpretation requires the Company to recognize a liability for the fair value of certain guarantees issued or modified after December 31, 2002. In addition, certain disclosures are required for the nature of the guarantees, the maximum potential future payments that could be required under the guarantees, and the current liability recorded for these guarantees. In accordance with the transition provisions of the interpretation, the Company adopted the disclosure provisions in December 2002. The Company does not expect the adoption of this statement to have a material impact on the Company's financial position, results of operations or cash flows.
In January 2003, the FASB issued Interpretation No. 46, "Consolidation of Variable Interest Entities" in an effort to expand upon and strengthen existing accounting guidance that addresses when a company should include in its financial statements the assets, liabilities and activities of another entity. Interpretation 46 requires a variable interest entity to be consolidated by a company if that company is subject to a majority of the risk of loss from the variable interest entity's activities or is entitled to receive a majority of the entity's residual returns or both. The Interpretation also requires disclosures about variable interest entities that the company is not required to consolidate but in which it has a significant variable interest. The consolidation requirements of Interpretation 46 apply immediately to variable interest entities created after January 31, 2003. The consolidation requirements apply to existing entities in the first fiscal year or interim period beginning after June 15, 2003. Certain of the disclosure requirements, which the Company has adopted, apply to financial statements issued after January 31, 2003, regardless of when the variable interest entity was established. The Company does not expect the adoption of this statement to have a material impact on the Company's financial position, results of operations or cash flows.
New Statement Lines and Minor Reclassifications
As described in a Form 8-K filed on April 9, 2002 (the "Original 8-K"), beginning in the first quarter of 2002, the Company added new statement lines in its consolidated statements of operations to align more closely with the financial statement presentation of other technology companies. As a result, and as reflected in the Original Form 8-K, the presentation format of historical financial information for 2000 and 2001 was changed so that the format was comparable to the presentation format adopted in 2002. This change in presentation format did not change the Company's results of operations as historically reported.
In connection with the change in presentation format reflected in the Original 8-K, certain 2001 depreciation expenses and software costs were misallocated to Costs of Sales rather than Selling, General and Administrative expenses. On October 15, 2002, a Form 8-K/A was filed to reflect the appropriate allocation of these costs and to provide reclassified consolidated statements of operations for 2001 that conform to the presentation format adopted in 2002. This reclassification only impacts the 2001 financial statements that were included in the Original 8-K, and does not impact 2001 financial statements that reflected the pre-2002 presentation format. Consistent with the Original 8-K, the reclassifications reflected in the Form 8-K/A, filed in October 2002, do not change the Company's results of operations as historically reported.
Item 7A. Quantitative and Qualitative Disclosures About Market Risk
Foreign Currency Risk
As a multinational company, the Company's transactions are denominated in a variety of currencies. The Company uses financial instruments to hedge, and therefore attempts to reduce its overall exposure to the effects of currency fluctuations on cash flows. The Company's policy is not to speculate in financial instruments for profit on the exchange rate price fluctuation, trade in currencies for which there are no underlying exposures, or enter into trades for any currency to intentionally increase the underlying exposure. Instruments used as hedges must be effective at reducing the risk associated with the exposure management policybeing hedged and strategy.must be designated as a hedge at the inception of the contract. Accordingly, changes in market values of hedge instruments must be highly correlated with changes in market values of underlying hedged items both at inception of the hedge and over the life of the hedge contract.
The Company's strategy in foreign exchange exposure issues is to offset the gains or losses of the financial instruments against losses or gains on the underlying operational cash flows or investments based on the operating business units' assessment of risk. Almost all of the Company's non-functional currency receivables and payables, which are denominated in major currencies that can be traded on open markets, are hedged. The Company uses forward contracts and options to hedge these currency exposures. In addition, the Company hedges some firmly committed transactions and some forecasted transactions. The Company expects that it may hedge investments in foreign subsidiaries in the
MANAGEMENT'S DISCUSSION AND ANALYSIS OF FINANCIAL CONDITION AND RESULTS OF OPERATIONS F-31
future. A portion of the Company's exposure is from currencies that are not traded in liquid markets, such as those in Latin America, and these are addressed, to the extent reasonably possible, through managing net asset positions, product pricing, and component sourcing.
At December 31, 2002 and 2001, the Company had net outstanding foreign exchange contracts totaling $2.1 billion and $3.1 billion, respectively. Management believes that these financial instruments should not subject the Company to undue risk due to foreign exchange movements because gains and losses on these contracts should offset losses and gains on the assets, liabilities, and transactions being hedged. The following table shows, in millions of U.S. dollars, the five largest net foreign exchange hedge positions as of December 31, 2002 and 2001:
| | December 31 | ||||||
|---|---|---|---|---|---|---|---|
| Buy (Sell) | 2002 | 2001 | |||||
| Chinese Renminbi | $ | (702 | ) | $ | (650 | ) | |
| British Pound | (323 | ) | (410 | ) | |||
| Japanese Yen | (262 | ) | (521 | ) | |||
| Canadian Dollar | 251 | 146 | |||||
| Brazilian Real | (100 | ) | (165 | ) | |||
The Company is exposed to credit-related losses if counterparties to financial instruments fail to perform their obligations. However, it does not expect any counterparties, which presently have high credit ratings, to fail to meet their obligations.
Foreign exchange financial instruments that are subject to the effects of currency fluctuations which may affect reported earnings include derivative financial instruments and other financial instruments, which are not denominated in the currency of the legal entity holding the instrument. Derivative financial instruments consist primarily of forward contracts. Other financial instruments, which are not denominated in the currency of the legal entity holding the instrument, consist primarily of cash, short-term deposits,investments, long-term financingfinance receivables, equity investments, and notes as well as accounts payable and receivable. Accounts payable and receivable are reflected at fair value in the financial statements. The fair value of the remainder of the foreign exchange financial instruments would hypothetically decrease by $69$61 million as of year-end 20012002 if the U.S. dollar were to appreciate against all other currencies by 10%. This hypothetical amount is suggestive of the effect on future cash flows under the following conditions: (i) all current payables and receivables that are hedged were not realized;realized, (ii) all hedged commitments and anticipated transactions were not realized or canceled, and (iii) hedges of these amounts were not canceled or offset. The Company does not expect that any of these conditions will be realized. The Company expects that gains and losses on the derivative financial instruments should offset gains and losses on the assets, liabilities and future transactions being hedged. If the hedged transactions were included in the sensitivity analysis, the hypothetical change in fair value would be immaterial. The foreign exchange financial instruments are held for purposes other than trading.
Argentina Exposure
In December 2001, the Argentine government issued currency withdrawal restrictions and banking and exchange holidays causing uncertainties in the financial markets. As a result of these government actions and the resulting currency devaluation, the Company established a $54 million reserve at December 31, 2001 to cover increased credit risk on U.S. dollar denominated receivables due from customers operating in Argentina.
In 2002, a new dual currency system was announced in Argentina creating a system in which certain transactions will be settled at an expected fixed rate of 1.4 pesos to the dollar, while non-qualifying transactions will be settled using a free floating market exchange rate which averaged 1.8 pesos to the dollar throughout January and subsequently has continued to fall. Also, the Argentine government set up a commission within the Ministry of Economy to discuss and establish policies for license agreements with incumbent operators of basic telephony services. The resulting policies require such operators to settle future transactions using the floating market exchange rate.
Motorola has a 25% equity investment in an Argentine operating company that offers telephony services. As a result of the prevailing economic environment and regulatory changes instituted in 2002 in Argentina, the Argentine peso was adopted as the functional currency for this entity. The impact of this change and the subsequent continued devaluation of the Argentine peso will result in the Company taking a first quarter 2002 charge of $95 million to write the value of the investment to zero.
Interest Rate Risk
The Company has fixed-income investments consisting of cash equivalents, short-term investments, and long-term finance receivables.
The majority of the long-term finance receivables are floating rate notes subject to periodic interest rate adjustments. The Company's practice is to fund these receivables with commercial paper to minimize the effects of interest rate changes. Management does not expect gains or losses on short-term investments and short-term debt to have a material effect on the Company's financial position, liquidity or results of operations.
In June 1999, the Company's finance subsidary entered into interest rate swaps to change the characteristics of the interest rate payments on its $500 million 6.75% debentures due 2004 from fixed-rate payments to short-term LIBOR based variable rate payments in order to match the funding with its underlying assets. The fair value of these interest rate swaps at December 31, 2001 was $38 million and would hypothetically decrease by $1.2 million if LIBOR rates were to increase by a hypothetical 10%.
Except for these interest rate swaps, at December 31, 2001, the Company had no outstanding commodity derivatives, currency swaps or options relating to either its debt instruments or investments.
Fair Value Hedges
The Company recorded charges (income) of $2 million and $(2) million for the years ended December 31, 2002 and 2001, respectively, representing the ineffective portionportions of changes in the fair value of fair value hedge positions reportedpositions. These amounts are included in earnings for the year ended December 31, 2001 was pre-tax income of $2.1 million and is recorded in selling, general and administrative expenseOther within Other Income (Expense) in the Company's consolidated statements of operations. The Company did not have any amount excluded from the measure of effectiveness and had no fair value hedges discontinued for the yearyears ended December 31, 2002 and 2001.
Cash Flow Hedges
The Company recorded charges (income) of $(.1) million and $9 million for the years ended December 31, 2002 and 2001, respectively, representing the ineffective portionportions of changes in the fair value of cash flow hedge positions reportedpositions. These amounts are included in earnings for the year ended December 31, 2001 resulted in a charge of $9.3 million before income taxes, and is recorded in selling, general and administrative expenseOther within Other Income (Expense) in the Company's consolidated statements of operations. The Company did not have any amount excluded from the measure of effectiveness and had no cash flow hedges discontinued for the yearyears ended December 31, 2002 and 2001.
F-30 MANAGEMENT'S DISCUSSION AND ANALYSIS OF FINANCIAL CONDITION AND RESULTS OF OPERATIONS
During the years ended December 31, 2002 and 2001, on a pre-tax basis, income of $10 million and $51 million, respectively, was reclassified from equity to earnings.earnings and is included in Other within Other Income (Expense) in the Company's consolidated statement of operations. If exchange rates do not change from year-end, the Company estimates that $6$2 million of pre-tax net derivative gainslosses included in other comprehensive incomeNon-Owner Changes to Equity within Stockholders' Equity would be reclassified into earnings within the next twelve months and will be reclassified in the same period that the hedged item affects earnings. The actual amounts that will be reclassified into earnings over the next twelve months will vary from this amount as a result of changes in market conditions.
At December 31, 2001,2002, the maximum term of derivative instruments that hedge forecasted transactions, except those related to payment of variable interest on existing financial instruments, was 3three years. However, on average, the duration of the Company's derivative instruments that hedge forecasted transactions was 8seven months.
Net Investment in Foreign Operations Hedge
At December 31, 2002 and 2001, the Company did not have any hedges of foreign currency exposure of net investments in foreign operations. However, the Company expects that it may hedge investments in foreign subsidiaries in the future.
F-32 MANAGEMENT'S DISCUSSION AND ANALYSIS OF FINANCIAL CONDITION AND RESULTS OF OPERATIONS
Investments Hedge
TheAt December 31, 2002, the Company doesdid not have any derivatives to hedge the value of its equity investments in affiliated companies. Since December 31, 2002, the Company has entered into hedge contracts with respect to some of its shares of Nextel common stock as described above in "Liquidity and Capital Resources—Investing Activities".
Fair Value of Financial Instruments
The Company's financial instruments include cash equivalents, short-term investments, accounts receivable, long-term finance receivables, accounts payable, and accrued liabilities, notes payable, long-term debt, foreign currency contracts and other financing commitments.
Using available market information, the Company determined that the fair value of long-term debt at December 31, 20012002 was $7.6$6.8 billion compared to a carrying value of $8.4$7.2 billion. Since considerable judgment is required in interpreting market information, the fair value of the long-term debt is not necessarily indicative of the amount which could be realized in a current market exchange.
The fair values of the other financing commitments could not be reasonably estimated at December 31, 2001. The fair values of the other financial instruments were not materially different from their carrying or contract values at December 31, 2001.2002.
Equity Price Market Risk
The value of the available for sale securities would change by $157 million as of year-end 2002 if the price of the stock in each of the publicly-traded companies were to change by 10%. These equity securities are held for purposes other than trading.
Interest Rate Risk
At December 31, 2002, the Company's short-term debt consisted primarily of $495 million of commercial paper, priced at short-term interest rates. The Company has $8.2 billion of long-term debt, including current maturities, which is primarily priced at long-term, fixed interest rates. To change the characteristics of a portion of these interest rate payments, the Company has entered into a number of interest rate swaps.
In March 2002, the Company entered into interest rate swaps to change the characteristics of interest rate payments on its $1.4 billion 6.75% debentures due 2006 and its $300 million 7.60% notes due 2007 from fixed-rate payments to short-term LIBOR based variable rate payments to manage fixed and floating rates in its debt portfolio. In June 1999, the Company's finance subsidiary entered into interest rate swaps to change the characteristics of the interest rate payments on its $500 million 6.75% debentures due 2004 from fixed-rate payments to short-term LIBOR based variable rate payments in order to match the funding with its underlying assets. The short-term LIBOR based variable payments on the interest rate swaps was 2.9% for the three months ended December 31, 2002. The fair value of the interest rate swaps as of December 31, 2002 was approximately $212 million and would hypothetically decrease by $17.1 million if LIBOR rates were to increase by a hypothetical 10%. Except for these interest rate swaps, at December 31, 2002, the Company had no outstanding derivatives, currency swaps or options relating to either its debt instruments or investments.
The Company is exposed to credit-related losses in the event of nonperformance by the counter parties to swap contracts. The Company minimizes its credit risk on these transactions by only dealing with leading, credit-worthy financial institutions having long-term debt ratings of "A" or better and, therefore, does not anticipate nonperformance. In addition, the contracts are distributed among several financial institutions, thus minimizing credit risk concentration.
Environmental Matters
A discussion of the Company's environmental matters is detailed in Note 89 to the consolidatedConsolidated Financial Statements.
Item 14. Controls and Procedures
(a) Evaluation of disclosure controls and procedures. Our chief executive officer and our chief financial statements.
Euro Conversion
On January 1, 1999,officer have concluded, based on their evaluation within 90 days before the Euro was created. Twelvefiling date of this annual report, that the fifteen member countriesCompany's "disclosure controls and procedures" (as defined in the Securities Exchange Act of the European Union (EU) have adopted the Euro as their common legal currency. Until January 1, 2002, either the Euro or a participating country's previous currency (a "national currency"1934 Rules 13a-14(c) and 15-d-14(c)) was accepted as legal currency. Since January 1, 2002, Euro-denominated notes and coins are being issued and national currencies are being withdrawn from circulation.
The Company formed a joint European-United States task forceeffective to assess the potential impact to the Company from the introduction of the Euro. In addition to tax and accounting considerations, the Company assessed the potential impact from the Euro conversion in a number of areas, including: (1) the technical challenges to adaptensure that information technology and other systems to accommodate Euro-denominated transactions; (2) the competitive impact of cross-border price transparency, which may make it more difficult for businesses to charge different prices for the same product in different countries; (3) the impact on existing contracts; and (4) the impact on currency exchange costs and currency exchange rate risk.
The Company established a Euro project plan with two phases. Each business segment was responsible for following this plan, and internal audit has reviewed progress against established milestones. Phase I of the plan was to enable the Companyrequired to be "Euro-capable," meaning able to process Euro transactionsdisclosed in the reports that we file or submit under the Securities Exchange Act of 1934 is recorded, processed, summarized and comply with all relevant EUreported within the time periods specified in the Securities and national regulations. All business segments accomplished this by January 1, 1999. Phase II of the plan was to enable various Motorola businessesExchange Commission's rules and forms.
(b) Changes in Europe to become "Euro-functional," meaning that the functional currency used by the businesses in relevant countries would be the Euro. This was accomplished by all business segments in 2001.
The introduction of the Euro and the phasing out of national currencies has not had a material adverse effect on the Company and the costs of the conversion to the Company have not been material.
internal controls.Significant Accounting Policies
Management's Discussion and Analysis of Financial Condition and Results of Operations discusses the Company's consolidated financial statements, which There have been preparedno significant changes in accordance with accounting principles generally acceptedour internal controls or in the United States of America. The preparation of these financial statements requires managementother factors that could significantly affect our disclosure controls and procedures subsequent to make estimates and assumptions that affect the reported amounts of assets and liabilities and the disclosure of contingent assets and liabilities at the date of the financial statements and the reported amounts of revenues and expenses during the reporting period.
On an ongoing basis, management evaluates its estimates and judgments, including those related to bad debts, inventories, investments, intangible and other long-livedpreviously-mentioned evaluation.
MANAGEMENT'S DISCUSSION AND ANALYSIS OF FINANCIAL CONDITION AND RESULTS OF OPERATIONS F-31
assets, income taxes, financing operations, warranty obligations, product returns, restructuring costs, retirement benefits, litigation and contingencies. Management bases its estimates and judgments on historical experience, current economic and industry conditions and on various other factors that are believed to be reasonable under the circumstances. This forms the basis for making judgments about the carrying values of assets and liabilities that are not readily apparent from other sources. Actual results may differ from these estimates under different assumptions or conditions. Management believes the following critical accounting policies affect its more significant judgments and estimates used in the preparation of its consolidated financial statements.
Valuation of Investments and Long-Lived Assets
The Company assesses the impairment of investments and long-lived assets, which includes identifiable intangible assets, goodwill and plant and equipment whenever events or changes in circumstances indicate that the carrying value may not be recoverable. Factors considered important which could trigger an impairment review include the following:
When the Company determines that the carrying value of intangible assets, goodwill and long-lived assets may not be recoverable an impairment charge is recorded. Impairment is measured based on a projected discounted cash flow method using a discount rate determined by our management to be commensurate with the risk inherent in our current business model or prevailing market rates of investment securities, if available.
Beginning in late 2000 and continuing throughout 2001 as a result of the Company's initiatives to consolidate operations and exit businesses, impairment reviews were performed. Based upon these reviews, management determined that various long-lived and intangible assets had been impaired and impairment charges were recorded totaling $963 million and $344 million for 2001 and 2000, respectively. These impaired assets were located primarily in the Semiconductor Products segment (at manufacturing locations in Texas, Arizona, Hong Kong, Japan and the 5-inch and 6-inch wafer technologies manufacturing facilities in Scotland) and in the Personal Communications segment (at manufacturing facilities in Illinois, Florida, Scotland, Ireland and Germany).
As a result of the downturn of the worldwide economic environment and capital markets, our available-for-sale securities portfolio reflected a net unrealized pre-tax loss of $1.9 billion in 2001. Management determined that the decline in the value of certain individual investments in the portfolio was other-than-temporary and recorded an impairment charge of $1.2 billion in 2001.
In 2002, Statement of Financial Accounting Standards ("SFAS") No. 142, "Goodwill and Other Intangible Assets" became effective and as a result, the Company will cease to amortize approximately $1.3 billion of unamortized goodwill. The Company had recorded approximately $165 million of amortization on these amounts during 2001. In lieu of amortization, the Company is required to perform an initial impairment review of our goodwill in 2002 and an impairment review at least annually thereafter. The Company has completed its review and does not expect to record an impairment charge based on these results.
At December 31, 2001 the net value of these assets were as follows (in millions):
| Property, plant and equipment | $ | 8,913 | |
| Investments | 2,995 | ||
| Intangible assets | 537 | ||
| Goodwill | 1,250 | ||
| Total | $ | 13,695 | |
The Company cannot predict the occurrence of future impairment triggering events nor the impact such events might have on these reported asset values. Such events may include strategic decisions made in response to the economic conditions relative to product lines, operations and the impact of the economic environment on our customer base.
F-32 MANAGEMENT'S DISCUSSION AND ANALYSIS OF FINANCIAL CONDITION AND RESULTS OF OPERATIONS
Allowance for Losses on Finance Receivables
The Company has historically provided financing to certain customers in connection with sizeable purchases of the Company's infrastructure equipment. Financing provided has included all or a portion of the equipment purchase price, as well as working capital for certain purchasers.
Total financing receivables at December 31, 2001 and 2000 were $2.76 billion and $2.89 billion, respectively, with an allowance for losses on these receivables of $1.65 billion and $239 million, respectively. Of the receivables at December 31, 2001, $2.54 billion ($916 million, net of allowance for losses of $1.62 billion) were considered impaired due to management's determination that the customer will not pay all amounts due according to the original contractual terms of the loan agreement. By comparison, impaired receivables at December 31, 2000 were $72 million ($48 million, net of allowance for losses of $24 million).
Management periodically reviews customer account activity in order to assess the adequacy of the allowances provided for potential losses. Factors considered include economic conditions, collateral values and each customer's payment history and credit worthiness. Adjustments, if any, are made to reserve balances following the completion of these reviews to reflect management's best estimate of potential losses. The resulting net receivable balance is intended to represent the estimated realizable value as determined based on the fair value of the underlying collateral, if the receivable is collateralized, or the present value of expected future cash flows discounted at the effective interest rate implicit in the underlying receivable.
Retirement-Related Benefits
The Company accounts for its pension benefits and its postretirement healthcare benefits using actuarial models required by SFAS No. 87, "Employers' Accounting for Pensions" and SFAS No. 106, "Employers' Accounting for Postretirement Benefits Other Than Pensions", respectively. These models use an attribution approach that generally spreads individual events over the service lives of the employees in the plan. Examples of "events" are plan amendments and changes in actuarial assumptions such as discount rate, expected long-term rate of return on plan assets, and rate of compensation increases. The principle underlying the required attribution approach is that employees render service over their service lives on a relatively smooth basis and, therefore, the income statement effects of pension benefits or postretirement healthcare benefits are earned in, and should follow, the same pattern.
One of the principal components of the net periodic pension calculation is the expected long-term rate of return on plan assets. The required use of expected long-term rate of return on plan assets may result in recognized pension income that is greater or less than the actual returns of those plan assets in any given year. Over time, however, the expected long-term returns are designed to approximate the actual long-term returns and therefore result in a pattern of income and expense recognition that more closely matches the pattern of the services provided by the employees. Differences between actual and expected returns are recognized in the net periodic pension calculation over five years.
The Company uses long-term historical actual return experience with consideration to the expected investment mix of the plans' assets, and future estimates of long-term investment returns to develop its expected rate of return assumption used in the net periodic pension calculation. Historically, the Company has experienced actual returns which on an on-going basis continue to support its 9% return assumption.
The discount rate assumptions used for pension benefits and postretirement healthcare benefits accounting reflects at December 31 of each year the prevailing market rates for high-quality fixed-income debt instruments that, if the pension benefit obligation was settled at the measurement date would provide the necessary future cash flows to pay the benefit obligation when due. Using this process, the Company changed its discount rate assumption from 7.5% to 7.25%, effective December 31, 2001. This change is not expected to have a material effect on the Company's 2002 results of operations.
The rate of compensation increase is another significant assumption used in the actuarial model for pension accounting and is determined by the Company based upon its long-term plans for such increases which currently is 4.5%. For retiree medical plan accounting, the Company reviews external data and its own historical trends for health care costs to determine the health care cost trend rates.
The impact on the future operating results of the company in relation to retirement-related benefits is dependent on economic conditions, employee demographics and investment performance.
Long-Term Contract Accounting
The Company applies the percentage-of-completion methodology as stated in Statement of Position 81-1 "Accounting for Performance of Construction-Type and Certain Production-Type Contracts" to recognize revenues on various long-term contracts involving proven technologies. These contracts primarily involve the design, engineering, manufacturing, and installation of wireless infrastructure communication systems in GTSS and two-way radio voice and data systems in CGISS. These systems are designed to meet specific customer specifications and typically require an extended period of time to construct.
We execute contracts with our customers that describe the equipment and system specifications that we will be delivering including the consideration we will be receiving. Revenue is recognized as work progresses on each contract and is based on the percentage of costs incurred to date
MANAGEMENT'S DISCUSSION AND ANALYSIS OF FINANCIAL CONDITION AND RESULTS OF OPERATIONS F-33
compared to the total estimated contract costs. We prepare estimates of total contract costs and of our progress toward completion of each contract using estimates and judgments based on historical experience and on other factors that we believe to be relevant under the circumstances. Management regularly assesses normal, recurring business risks and uncertainties inherent in these customer contracts and considers the impact, if any, of these uncertainties in the preparation of contract estimates. These uncertainties may include system performance and implementation delays resulting from events both within and outside the control of the Company. Losses on individual contracts, if any, are recognized during the period in which the loss first becomes evident.
Changes in these estimates could negatively impact the Company's operating results. In addition, unforeseen conditions could arise over the contract term that may have a significant impact on the operating results. It is reasonably likely that different operating results would be reported if the Company used other acceptable revenue recognition methodologies, such as the completed-contract method, or applied different assumptions.
Deferred Tax Asset Valuation
The Company recognizes deferred tax assets and liabilities based on the differences between the financial statement carrying amounts and the tax bases of assets and liabilities. The Company regularly reviews its deferred tax assets for recoverability and establishes a valuation allowance based on historical taxable income, projected future taxable income, the expected timing of the reversals of existing temporary differences and the implementation of tax-planning strategies. If the Company continues to operate at a loss or is unable to generate sufficient future taxable income, or if there is a material change in the actual effective tax rates or time period within which the underlying temporary differences become taxable or deductible, the Company could be required to increase its valuation allowance against its deferred tax assets resulting in an increase in its effective tax rate and an adverse impact on operating results.
At December 31, 2001, the Company had U.S. tax carryforwards of approximately $1.8 billion, primarily foreign tax credit carryovers of which $166 million, if unused, will expire in 2002. The deferred tax asset for U.S. tax carryforwards is determined to be realizable based on management's estimates of future taxable income and the implementation of certain tax-planning strategies. As a result no valuation allowance has been provided. Should the Company fail to generate enough taxable income in 2002 to utilize the foreign tax credit carryovers that are scheduled to expire, the portion of the credits unused will result in an increase in the Company's effective tax rate. In addition, certain non-U.S. subsidiaries, primarily in Germany and the UK, have generated tax loss carryforwards resulting in gross deferred tax assets of $527 million at December 31, 2001. Due to the uncertainty in certain countries as to the realizability of these amounts, management has provided a valuation allowance of $493 million at December 31, 2001 resulting in net non-U.S. subsidiary deferred tax assets of $34 million.
Inventory Valuation Reserves
The Company records valuation reserves on its inventory for estimated obsolescence or unmarketability. The amount of the writedown is equal to the difference between the cost of inventory and the estimated market value based upon assumptions about future demand and market conditions. In addition to normal excess and obsolescence provisions for inventory the Company recorded charges for product portfolio simplifications in its businesses in 2000 and 2001 mainly in the PCS business. In the latter half of 2000, actual demand and market conditions lead the Company to discontinue analog and first-generation digital wireless telephones. As a result, the Company recorded inventory write downs of $825 million in 2000. During 2001, the Company recorded an additional $585 million of inventory write downs due to accelerated erosion of average selling prices for these products.
Net Inventories consisted of the following:
| December 31 | 2001 | 2000 | |||||
|---|---|---|---|---|---|---|---|
| Finished goods | $ | 1,140 | $ | 2,005 | |||
| Work-in-process and production materials | 2,782 | 4,281 | |||||
| 3,922 | 6,286 | ||||||
| Less inventory reserves | (1,166 | ) | (1,044 | ) | |||
| $ | 2,756 | $ | 5,242 | ||||
The Company balances the need to maintain strategic inventory levels to ensure competitive lead times with the risk of inventory obsolescence due to rapidly changing technology and customer requirements. If actual future demand or market conditions are less favorable than those projected by management, additional inventory write downs may be required.
Recent Accounting Pronouncements
In June 2001, the FASB issued SFAS No. 141, "Business Combinations" and SFAS No. 142, "Goodwill and Other Intangible Assets". Statement 141 requires that the purchase method of accounting be used for all business combinations subsequent to June 30, 2001 and specifies criteria for recognizing intangible assets acquired in a business combination. Statement 142 requires that goodwill no longer be amortized, but instead be tested for impairment at least annually. Goodwill related to acquisitions prior to July 1, 2001 continued to be amortized through December 31, 2001 as required in the transition guidance. Goodwill related to acquisitions subsequent to June 30, 2001 was not amortized. If it had been amortized it would have reduced earnings by $19 million in 2001. Intangible assets with definite
F-34 MANAGEMENT'S DISCUSSION AND ANALYSIS OF FINANCIAL CONDITION AND RESULTS OF OPERATIONS
useful lives will continue to be amortized over their respective estimated useful lives. Statement No. 142 is effective January 1, 2002. The Company does not expect the adoption of this statement will have a material impact on the Company's financial position, results of operations or cash flows.
In June 2001, the FASB issued Statement No. 143, "Accounting for Asset Retirement Obligations." This statement requires that the fair value of a liability for legal obligations associated with the retirement of tangible long-lived assets be recognized in the period in which it is incurred if a reasonable estimate of fair value can be made. Such legal obligations include obligations a party is required to settle as a result of an existing or enacted law, statute, or ordinance, or written or oral contract. These associated asset retirement costs are capitalized as part of the carrying amount of the long-lived asset. This statement is effective for fiscal years beginning after June 15, 2002. The Company does not expect that the adoption of this statement will have a material impact on the Company's financial position, results of operations or cash flows.
In August 2001, the FASB issued Statement No. 144, "Accounting for the Impairment or Disposal of Long-Lived Assets" which addresses financial accounting and reporting for the impairment or disposal of long-lived assets. While the statement supersedes Statement No. 121, "Accounting for the Impairment of Long-Lived Assets and for Long-Lived Assets to Be Disposed Of", it retains many of the fundamental provisions of that statement. Statement No. 144 also retains the requirement to report separately discontinued operations (Opinion No. 30) and extends that reporting to a component of an entity that either has been disposed of by sale, abandonment, or in a distribution to owners or is classified as held for sale. Statement No. 144 is effective for fiscal years beginning after December 15, 2001. The Company does not expect the adoption of this statement will have a material impact on the Company's financial position, results of operations or cash flows.
Business Risks
With the exception ofStatements that are not historical facts the statements in Management's Discussion and Analysis of Financial Condition and Results of Operations are forward-looking statements based on current expectations that involve risks and uncertainties. Forward-looking statements include, but are not limited to, statements included under the heading "Earnings Outlook for 2003" and statements about: (i) 2002future financial performance by the Company or any of its segments, including sales, orders and profitability;profitability, (ii) special itemsreorganization of businesses or other charges that may occur in 2002;the future, (iii) manufacturing and other costsgross margin for the Company or any of sales in 2002;its segments, (iv) selling, general and administrative costs in 2002;expenditures, (v) research and development expenditures, (vi) net interest expense, (vii) future charges, payments, use
MANAGEMENT'S DISCUSSION AND ANALYSIS OF FINANCIAL CONDITION AND RESULTS OF OPERATIONS F-33
of accruals and cost savings in 2002; (vi)connection with reorganization of businesses programs, (viii) effective tax rates, (ix) the Company's ability and cost to repatriate additional funds, (x) capital expenditures by the Company or any of its segments, in 2002; (vii) depreciation expense in 2002; (viii) future charges, payments and use of accruals in connection with reorganization of businesses programs; (ix) interest expense in 2002; (x) the effective tax rate for 2002; (xi) net accounts receivable and weeks receivable in 2002;levels, (xii) inventory levels and inventory turns, in 2002; (xiii) cost savings from reorganizationlevel of businesses programs;commercial paper borrowings, (xiv) the Company's ability to access the capital markets;markets, (xv) the impact on the Company from a change in credit ratings, (xvi) future cash contributions to pension plans or retiree health benefit plans, (xvii) the outcome of ongoing and future legal proceedings, including those relating to Iridium, (xviii) the adequacy of reserves relating to long-term finance receivables and other contingencies; (xvi) the outcome of pending litigation; (xvii) 2002contingencies, (xix) industry shipments of wireless handsets; (xviii)handsets, (xx) average selling prices for wireless handsets, (xxi) expected market share gains; (xix) industry-wide sales of wireless infrastructure equipment in 2002; (xx) timing of migration to UMTS; (xxi) the impact tofor the Company or any of its segments, from losing major customers; (xxii) expected market share gains;closures of wafer fabrication facilities and other semiconductor manufacturing facilities, (xxiii) the levelimpact of financing support provided to customers;the semiconductor product segment's "asset light" business model, (xxiv) worldwide semiconductor industry sales, (xxv) worldwide industry sales for the two-way radio market; (xxv) 2002 capital spending by communications providers;of wireless infrastructure equipment, (xxvi) worldwide semiconductor industry growth in 2002;sales of two-way radios, (xxvii) the introductionimpact of new products or technologyregulatory and customer-driven changes on the cable equipment industry, (xxviii) worldwide broadband equipment industry sales, (xxix) the impact on the Company, and (xxviii)of acquisitions or divestitures, (xxx) the impact of ongoing currency policy in Argentinaforeign jurisdictions and other foreign currency exchange risks.risks, (xxxi) future hedging activity by the Company, (xxxii) the ability of counterparties to financial instruments to perform their obligations, (xxxiii) future obligations under existing guarantees, and (xxxiv) the impact of recent accounting pronouncements on the Company.
We wishThe Company wishes to caution the reader that the following important business risks and factors below, and those business risks and factors described elsewhere in the commentary or in our other Securities and Exchange Commission filings, could cause ourthe Company's actual results to differ materially from those stated in the forward-looking statements.
General
Impact of the Economic Recession
Downturn in the Telecommunications Industry
Uncertainty of Current Economic and Political Conditions
MANAGEMENT'S DISCUSSION AND ANALYSIS OF FINANCIAL CONDITION AND RESULTS OF OPERATIONS F-35
and global economies will have a significant impact on our overall performance.
Impact
Lack of Predictability of Operating Results
Impact of Cost-Reduction Efforts
F-34 MANAGEMENT'S DISCUSSION AND ANALYSIS OF FINANCIAL CONDITION AND RESULTS OF OPERATIONS
Since these
Cost of Licenses to Use Radio Frequencies
Adequate Supplies
Financial Flexibility
MANAGEMENT'S DISCUSSION AND ANALYSIS OF FINANCIAL CONDITION AND RESULTS OF OPERATIONS F-35
source. Outstanding commercial paper decreased from $6.2 billion at the end of 2000 to $514 million at the end of 2001. There can be no assurances that we will continue to have access to the commercial paper markets on favorable terms.
Ability to Draw Underunder Credit Facilities and Obtain New Credit FacilitiesRenew One-Year Facility
Strategic Acquisitions and the Integration of New Businesses
Strategic Alliances
Fluctuations in the Fair Values of Portfolio Investments
Future Possible Impairment of Certain Assets
F-36 MANAGEMENT'S DISCUSSION AND ANALYSIS OF FINANCIAL CONDITION AND RESULTS OF OPERATIONS
borrow under these credit facilitiesof this goodwill became impaired, it would negatively impact our earnings.
Deferred Tax Assets
Recruitment and Retention of Employees
Changes in Government Policy or Economic Conditions
Risk Related to Our International Operations and Sales
Uncertainties of the Internet
MANAGEMENT'S DISCUSSION AND ANALYSIS OF FINANCIAL CONDITION AND RESULTS OF OPERATIONS F-37
Outcome of Litigation; Protection of Patents
Uncertainties Related to Insurance
Rapid Technological ChangeDownturn in the Telecommunications Industry
Uncertainty of Current Economic and Political Conditions
Impact of new productsCost-Reduction Efforts
F-34 MANAGEMENT'S DISCUSSION AND ANALYSIS OF FINANCIAL CONDITION AND RESULTS OF OPERATIONS
Cost of Licenses to Use Radio Frequencies
Adequate Supplies
Financial Flexibility
MANAGEMENT'S DISCUSSION AND ANALYSIS OF FINANCIAL CONDITION AND RESULTS OF OPERATIONS F-35
source. There can be no assurances that we will continue to have access to the commercial paper markets on favorable terms.
Ability to Draw under Credit Facilities and Renew One-Year Facility
Strategic Acquisitions and the Integration of New Businesses
Strategic Alliances
Fluctuations in the Fair Values of Portfolio Investments
Future Possible Impairment of Certain Assets
F-36 MANAGEMENT'S DISCUSSION AND ANALYSIS OF FINANCIAL CONDITION AND RESULTS OF OPERATIONS
of this goodwill became impaired, it would negatively impact our earnings.
Deferred Tax Assets
Recruitment and Retention of Employees
MANAGEMENT'S DISCUSSION AND ANALYSIS OF FINANCIAL CONDITION AND RESULTS OF OPERATIONS F-37
compete and develop successful new products. We may not be as successful at recruiting, assimilating and retaining these highly-skilled personnel as our competitors, especially because of our recent employee reductions.
Changes in Government Policy or Economic Conditions
RisksRisk Related to Our International Operations and Sales
Uncertainties of the Internet
MANAGEMENT'S DISCUSSION AND ANALYSIS OF FINANCIAL CONDITION AND RESULTS OF OPERATIONS F-37
Outcome of Litigation; Protection of Patents
Actual Adverse Market ConditionsUncertainties Related to Insurance
Impact of Foreign Currency Fluctuations
Communications Businesses
Downturn in the Telecommunications Industry
DevelopmentUncertainty of New ProductsCurrent Economic and TechnologiesPolitical Conditions
F-38Impact of Cost-Reduction Efforts
F-34 MANAGEMENT'S DISCUSSION AND ANALYSIS OF FINANCIAL CONDITION AND RESULTS OF OPERATIONS
development of industry standards, (iv) the significant amount of resources we must devote to the development of new technology, and (v) the
Increasing Cost of Licenses to Use Radio Frequencies
Adequate Supplies
Financial Flexibility
MANAGEMENT'S DISCUSSION AND ANALYSIS OF FINANCIAL CONDITION AND RESULTS OF OPERATIONS F-35
source. There can be no assurances that we will continue to have access to the commercial paper markets on favorable terms.
Ability to Draw under Credit Facilities and Renew One-Year Facility
Strategic Acquisitions and the Integration of New Businesses
Strategic Alliances
Fluctuations in the Fair Values of Portfolio Investments
Future Possible Impairment of Certain Assets
F-36 MANAGEMENT'S DISCUSSION AND ANALYSIS OF FINANCIAL CONDITION AND RESULTS OF OPERATIONS
of this goodwill became impaired, it would negatively impact our earnings.
Deferred Tax Assets
Recruitment and Retention of Employees
Changes in Government Policy or Economic Conditions
Risk Related to Our International Operations and Sales
Uncertainties of the Internet
MANAGEMENT'S DISCUSSION AND ANALYSIS OF FINANCIAL CONDITION AND RESULTS OF OPERATIONS F-37
Outcome of Litigation; Protection of Patents
Uncertainties Related to Insurance
Rapid Technological Change
Development of New Products and Technologies
Transition to Newer Digital Technologies
Demand for Customer Financing
Customer Credit Risk
F-38 MANAGEMENT'S DISCUSSION AND ANALYSIS OF FINANCIAL CONDITION AND RESULTS OF OPERATIONS
Risks from Large System Contracts
Need for Renewed Growth in the Cable Industry
Impact of Consolidations in the Telecommunications and Cable Industries
MANAGEMENT'S DISCUSSION AND ANALYSIS OF FINANCIAL CONDITION AND RESULTS OF OPERATIONS F-39Regulatory and other Changes Impacting our Cable Products
Embedded Solutions Businesses
Recovery from Semiconductor Market Recession
Ability to Compete in Semiconductor Market
Success and Impact of Increased Use of Semiconductor Foundry and Contract House Manufacturing Capacity and Partnerships
MANAGEMENT'S DISCUSSION AND ANALYSIS OF FINANCIAL CONDITION AND RESULTS OF OPERATIONS F-39
Renewed Growth in the Automobile Industry
The use of the word "significant" in this document indicates a change of greater than 25%, unless the context indicates otherwise. The use of the words "very significant" indicates a change of greater than 50% unless the context indicates otherwise.
MOTOROLA and the Stylized M Logo are registered in the U.S. Patent and Trademark Office. All other products or service namestrademarks indicated as such herein are the property of their respective owners.
Iridium® is a registered trademark and service mark of Iridium LLC.
SM "Puttable Reset Securities PURS" is a service mark of Goldman, Sachs & Co.
© Motorola, Inc. 20022003
F-40 MANAGEMENT'S DISCUSSION AND ANALYSIS OF FINANCIAL CONDITION AND RESULTS OF OPERATIONS
Motorola, Inc. and Subsidiaries
Financial Highlights
| | Years ended December 31 | Years Ended December 31 | |||||||||||
|---|---|---|---|---|---|---|---|---|---|---|---|---|---|
| (Dollars in millions, except as noted) | 2001 | 2000 | 2002 | 2001 | |||||||||
| Net sales | $ | 30,004 | $ | 37,580 | $ | 26,679 | $ | 29,873 | |||||
| Earnings (loss) before income taxes | $ | (5,511 | ) | $ | 2,231 | ||||||||
| % to sales | (18.4)% | 5.9% | |||||||||||
| Net earnings (loss) | $ | (3,937 | ) | $ | 1,318 | ||||||||
| % to sales | (13.1)% | 3.5% | |||||||||||
| Diluted earnings (loss) per common share (in dollars) | $ | (1.78 | ) | $ | 0.58 | ||||||||
| Operating loss | (1,813 | ) | (5,803 | ) | |||||||||
| % of sales | (6.8)% | (19.4)% | |||||||||||
| Loss before income taxes | (3,446 | ) | (5,511 | ) | |||||||||
| % of sales | (12.9)% | (18.4)% | |||||||||||
| Net loss | (2,485 | ) | (3,937 | ) | |||||||||
| % of sales | (9.3)% | (13.2)% | |||||||||||
| Diluted loss per common share (in dollars) | (1.09 | ) | (1.78 | ) | |||||||||
| Research and development expenditures | $ | 4,318 | $ | 4,437 | 3,754 | 4,318 | |||||||
| Capital expenditures | $ | 1,321 | $ | 4,131 | 607 | 1,321 | |||||||
| Working capital | $ | 7,451 | $ | 3,628 | 7,324 | 7,451 | |||||||
| Current ratio | 1.77 | 1.22 | 1.75 | 1.77 | |||||||||
| Return on average invested capital | (18.0)% | 6.3% | (15.9)% | (18.0)% | |||||||||
| Return on average stockholders' equity | (24.8)% | 6.6% | (20.6)% | (24.8)% | |||||||||
| % of net debt to net debt plus equity | 18.4% | 27.4% | 16.7% | 18.4% | |||||||||
| Book value per common share (in dollars) | $ | 6.07 | $ | 8.49 | $ | 4.85 | $ | 6.07 | |||||
| Year-end employment (in thousands) | 111 | 147 | 97 | 111 | |||||||||
FINANCIAL HIGHLIGHTS F-41
MANAGEMENT'S RESPONSIBILITY FOR FINANCIAL STATEMENTS
Management is responsible for the preparation, integrity and objectivity of the consolidated financial statements and other financial information presented in this report. The accompanying consolidated financial statements were prepared in accordance with accounting principles generally accepted in the United States of America, applying certain estimates and judgments as required.
Motorola's internal controls are designed to provide reasonable assurance as to the integrity and reliability of the financial statements and to adequately safeguard, verify and maintain accountability of assets. Such controls are based on established written policies and procedures, are implemented by trained, skilled personnel with an appropriate segregation of duties and are monitored through a comprehensive internal audit program. These policies and procedures prescribe that the Company and all its employees are to maintain the highest ethical standards and that its business practices throughout the world are to be conducted in a manner which is above reproach.
KPMG LLP, independent auditors, are retained to audit Motorola's financial statements. Their accompanying report is based on audits conducted in accordance with auditing standards generally accepted in the United States of America, which include the consideration of the Company's internal controls to establish a basis for reliance thereon in determining the nature, timing and extent of audit tests to be applied.
The Board of Directors exercises its responsibility for these financial statements through its Audit and Legal Committee, which consists entirely of independent non-management Board members. The Audit and Legal Committee meets periodically with the independent auditors and with the Company's internal auditors, both privately and with management present, to review accounting, auditing, internal controls and financial reporting matters.
|   | |
| Christopher B. Galvin Chairman of the Board and Chief Executive Officer | Executive Vice President and Chief Financial Officer |
F-42 CONSOLIDATED FINANCIAL STATEMENTS
INDEPENDENT AUDITORS' REPORT
The Board of Directors and Stockholders
Motorola, Inc.:
We have audited the accompanying consolidated balance sheets of Motorola, Inc. and Subsidiaries as of December 31, 20012002 and 2000,2001, and the related consolidated statements of operations, stockholders' equity and cash flows for each of the years in the three-year period ended December 31, 2001.2002. These consolidated financial statements are the responsibility of the Company's management. Our responsibility is to express an opinion on these consolidated financial statements based on our audits.
We conducted our audits in accordance with auditing standards generally accepted in the United States of America. Those standards require that we plan and perform the audit to obtain reasonable assurance about whether the financial statements are free of material misstatement. An audit includes examining, on a test basis, evidence supporting the amounts and disclosures in the financial statements. An audit also includes assessing the accounting principles used and significant estimates made by management, as well as evaluating the overall financial statement presentation. We believe that our audits provide a reasonable basis for our opinion.
In our opinion, the consolidated financial statements referred to above present fairly, in all material respects, the financial position of Motorola, Inc. and Subsidiaries as of December 31, 20012002 and 2000,2001, and the results of their operations and their cash flows for each of the years in the three-year period ended December 31, 2001,2002, in conformity with accounting principles generally accepted in the United States of America.
As discussed in Notes 1 and 8 to the consolidated financial statements, the Company adopted the provisions of Statement of Financial Accounting Standards No. 142, "Goodwill and Other Intangible Assets" on January 1, 2002.
![]()
![]()
Chicago, Illinois
January 18, 200221, 2003, except as to the fifth paragraph of Note 9,
which is as of March 4, 2003
CONSOLIDATED FINANCIAL STATEMENTS F-43
Motorola, Inc. and Subsidiaries
Consolidated Statements of Operations
| | Years Ended December 31 | ||||||||||
|---|---|---|---|---|---|---|---|---|---|---|---|
| (In millions, except per share amounts) | 2001 | 2000 | 1999 | ||||||||
| NET SALES | $ | 30,004 | $ | 37,580 | $ | 33,075 | |||||
| COSTS AND EXPENSES | |||||||||||
| Manufacturing and other costs of sales | 21,445 | 23,628 | 20,631 | ||||||||
| Selling, general and administrative expenses | 3,703 | 5,141 | 5,220 | ||||||||
| Research and development expenditures | 4,318 | 4,437 | 3,560 | ||||||||
| Depreciation expense | 2,357 | 2,352 | 2,243 | ||||||||
| Reorganization of businesses | 1,858 | 596 | (226 | ) | |||||||
| Other charges | 3,328 | 517 | 1,406 | ||||||||
| Interest expense, net | 437 | 248 | 138 | ||||||||
| Gains on sales of investments and businesses | (1,931 | ) | (1,570 | ) | (1,180 | ) | |||||
| TOTAL COSTS AND EXPENSES | 35,515 | 35,349 | 31,792 | ||||||||
| EARNINGS (LOSS) BEFORE INCOME TAXES | (5,511 | ) | 2,231 | 1,283 | |||||||
| INCOME TAX PROVISION (BENEFIT) | (1,574 | ) | 913 | 392 | |||||||
| NET EARNINGS (LOSS) | $ | (3,937 | ) | $ | 1,318 | $ | 891 | ||||
| BASIC EARNINGS (LOSS) PER COMMON SHARE | $ | (1.78 | ) | $ | 0.61 | $ | 0.42 | ||||
| DILUTED EARNINGS (LOSS) PER COMMON SHARE | $ | (1.78 | ) | $ | 0.58 | $ | 0.41 | ||||
| BASIC WEIGHTED AVERAGE COMMON SHARES OUTSTANDING | 2,213.3 | 2,170.1 | 2,119.5 | ||||||||
| DILUTED WEIGHTED AVERAGE COMMON SHARES OUTSTANDING | 2,213.3 | 2,256.6 | 2,202.0 | ||||||||
| | Years Ended December 31 | ||||||||||
|---|---|---|---|---|---|---|---|---|---|---|---|
| (In millions, except per share amounts) | 2002 | 2001 | 2000 | ||||||||
| Net sales | $ | 26,679 | $ | 29,873 | $ | 37,346 | |||||
| Costs of sales | 17,938 | 22,661 | 25,168 | ||||||||
| Gross margin | 8,741 | 7,212 | 12,178 | ||||||||
| Selling, general and administrative expenses | 4,203 | 4,723 | 5,733 | ||||||||
| Research and development expenditures | 3,754 | 4,318 | 4,437 | ||||||||
| Reorganization of businesses | 1,764 | 1,858 | 596 | ||||||||
| Other charges | 833 | 2,116 | 517 | ||||||||
| Operating earnings (loss) | (1,813 | ) | (5,803 | ) | 895 | ||||||
| Other income (expense): | |||||||||||
| Interest expense, net | (356 | ) | (413 | ) | (171 | ) | |||||
| Gains on sales of investments and businesses, net | 96 | 1,931 | 1,570 | ||||||||
| Other | (1,373 | ) | (1,226 | ) | (63 | ) | |||||
| Total other income (expense) | (1,633 | ) | 292 | 1,336 | |||||||
| Earnings (loss) before income taxes | (3,446 | ) | (5,511 | ) | 2,231 | ||||||
| Income tax expense (benefit) | (961 | ) | (1,574 | ) | 913 | ||||||
| Net earnings (loss) | $ | (2,485 | ) | $ | (3,937 | ) | $ | 1,318 | |||
Earnings (loss) per common share: | |||||||||||
| Basic | $ | (1.09 | ) | $ | (1.78 | ) | $ | 0.61 | |||
| Diluted | $ | (1.09 | ) | $ | (1.78 | ) | $ | 0.58 | |||
Weighted average common shares outstanding: | |||||||||||
| Basic | 2,282.3 | 2,213.3 | 2,170.1 | ||||||||
| Diluted | 2,282.3 | 2,213.3 | 2,256.6 | ||||||||
Dividends paid per share | $ | 0.16 | $ | 0.16 | $ | 0.16 | |||||
See accompanying notes to consolidated financial statements.
F-44 CONSOLIDATED FINANCIAL STATEMENTS
Motorola, Inc. and Subsidiaries
Consolidated Balance Sheets
| | | December 31 | | December 31 | |||||||||||
|---|---|---|---|---|---|---|---|---|---|---|---|---|---|---|---|
| (In millions, except per share amounts) | (In millions, except per share amounts) | 2001 | 2000 | (In millions, except per share amounts) | 2002 | 2001 | |||||||||
| ASSETS | ASSETS | ASSETS | |||||||||||||
| Current assets | Current assets | Current assets | |||||||||||||
| Cash and cash equivalents | Cash and cash equivalents | $ | 6,082 | $ | 3,301 | Cash and cash equivalents | $ | 6,507 | $ | 6,082 | |||||
| Short-term investments | Short-term investments | 80 | 354 | Short-term investments | 59 | 80 | |||||||||
| Accounts receivable, net | Accounts receivable, net | 4,583 | 7,092 | Accounts receivable, net | 4,437 | 4,583 | |||||||||
| Inventories, net | Inventories, net | 2,756 | 5,242 | Inventories, net | 2,869 | 2,756 | |||||||||
| Deferred income taxes | Deferred income taxes | 2,633 | 2,294 | Deferred income taxes | 2,358 | 2,633 | |||||||||
| Other current assets | Other current assets | 1,015 | 1,602 | Other current assets | 904 | 1,015 | |||||||||
| Total current assets | 17,149 | 19,885 | Total current assets | 17,134 | 17,149 | ||||||||||
| Property, plant and equipment, net | Property, plant and equipment, net | 8,913 | 11,157 | Property, plant and equipment, net | 6,104 | 8,913 | |||||||||
| Investments | Investments | 2,995 | 5,926 | Investments | 2,053 | 2,954 | |||||||||
| Long-term deferred income taxes | 1,152 | — | |||||||||||||
| Deferred income taxes | Deferred income taxes | 3,112 | 1,152 | ||||||||||||
| Other assets | Other assets | 3,189 | 5,375 | Other assets | 2,749 | 3,230 | |||||||||
| TOTAL ASSETS | $ | 33,398 | $ | 42,343 | Total assets | $ | 31,152 | $ | 33,398 | ||||||
| LIABILITIES AND STOCKHOLDERS' EQUITY | LIABILITIES AND STOCKHOLDERS' EQUITY | LIABILITIES AND STOCKHOLDERS' EQUITY | |||||||||||||
| Current liabilities | Current liabilities | Current liabilities | |||||||||||||
| Notes payable and current portion of long-term debt | Notes payable and current portion of long-term debt | $ | 870 | $ | 6,391 | Notes payable and current portion of long-term debt | $ | 1,629 | $ | 870 | |||||
| Accounts payable | Accounts payable | 2,434 | 3,492 | Accounts payable | 2,268 | 2,434 | |||||||||
| Accrued liabilities | Accrued liabilities | 6,394 | 6,374 | Accrued liabilities | 5,913 | 6,394 | |||||||||
| Total current liabilities | 9,698 | 16,257 | Total current liabilities | 9,810 | 9,698 | ||||||||||
| Long-term debt | Long-term debt | 8,372 | 4,293 | Long-term debt | 7,189 | 8,372 | |||||||||
| Long-term deferred income taxes | — | 1,504 | |||||||||||||
| Other liabilities | Other liabilities | 1,152 | 1,192 | Other liabilities | 2,429 | 1,152 | |||||||||
Company-obligated mandatorily redeemable preferred securities of subsidiary trust holding solely company- guaranteed debentures | Company-obligated mandatorily redeemable preferred securities of subsidiary trust holding solely company- guaranteed debentures | 485 | 485 | Company-obligated mandatorily redeemable preferred securities of subsidiary trust holding solely company- guaranteed debentures | 485 | 485 | |||||||||
Stockholders' equity | Stockholders' equity | Stockholders' equity | |||||||||||||
| Preferred stock, $100 par value issuable in series Authorized shares: 0.5 (none issued) | — | — | |||||||||||||
| Common stock, $3 par value Authorized shares: 2001 and 2000, 4,200 Issued and outstanding: 2001—2,254.0; 2000—2,191.2 | 6,764 | 6,574 | |||||||||||||
| Preferred stock, $100 par value | Preferred stock, $100 par value | ||||||||||||||
| Authorized shares: 0.5 (none issued) | — | — | |||||||||||||
| Common stock, $3 par value Authorized shares: 2002 and 2001—4,200.0 Issued and outstanding: 2002—2,315.3; 2001—2,254.0 | Common stock, $3 par value Authorized shares: 2002 and 2001—4,200.0 Issued and outstanding: 2002—2,315.3; 2001—2,254.0 | 6,947 | 6,764 | ||||||||||||
| Additional paid-in capital | Additional paid-in capital | 1,707 | 1,188 | Additional paid-in capital | 2,233 | 1,707 | |||||||||
| Retained earnings | Retained earnings | 5,434 | 9,727 | Retained earnings | 2,582 | 5,434 | |||||||||
| Non-owner changes to equity | Non-owner changes to equity | (214 | ) | 1,123 | Non-owner changes to equity | (523 | ) | (214 | ) | ||||||
| Total stockholders' equity | 13,691 | 18,612 | Total stockholders' equity | 11,239 | 13,691 | ||||||||||
| TOTAL LIABILITIES AND STOCKHOLDERS' EQUITY | $ | 33,398 | $ | 42,343 | Total liabilities and stockholders' equity | $ | 31,152 | $ | 33,398 | ||||||
See accompanying notes to consolidated financial statements.
CONSOLIDATED FINANCIAL STATEMENTS F-45
Motorola, Inc. and Subsidiaries
Consolidated Statements of Stockholders' Equity
| | |
See accompanying notes to consolidated financial statements. F-46 CONSOLIDATED FINANCIAL STATEMENTS Motorola, Inc. and Subsidiaries
See accompanying notes to consolidated financial statements. CONSOLIDATED FINANCIAL STATEMENTS F-47 1. Summary of Significant Accounting Policies Principles of Consolidation: The consolidated financial statements include the accounts of the Company and all majority-owned Cash Equivalents: The Company considers all highly liquid investments purchased with an original maturity of three months or less to be cash equivalents. Revenue Recognition: The Company recognizes revenue for product sales when title transfers, the risks and rewards of ownership have been transferred to the customer, the fee is fixed and determinable, and collection of the related receivable is probable which is generally at the time of shipment. Accruals are established for price protection, returns and cooperative marketing programs for distributors related to these sales. For long-term contracts, the Company uses the percentage-of-completion method to recognize revenues and costs based on the percentage of costs incurred to date compared to the total estimated contract costs. For contracts involving new unproven technologies, revenues and profits or parts thereof are deferred until technological feasibility is established, customer acceptance is obtained and other contract-specific terms have been completed. Provisions for losses are recognized during the period in which the loss first becomes apparent. Revenue for services is recognized ratably over the contract term or as services are being performed. Inventories: Inventories are valued at the lower of average cost (which approximates computation on a first-in, first-out basis) or market (net realizable value or replacement cost). Property, Plant and Equipment: Property, plant and equipment are stated at cost less accumulated depreciation. Depreciation is recorded Intangible Assets: Impairment of Long-Lived Assets: Long-lived assets held and used by the Company and intangible assets are reviewed for impairment whenever events or changes in circumstances indicate that the carrying amount of assets may not be recoverable. The Company evaluates recoverability of assets to be held and used by comparing the carrying amount of an asset to future net undiscounted cash flows to be generated by the assets. If such assets are considered to be impaired, the impairment to be recognized is measured by the amount by which the carrying amount of the assets exceeds the fair value of the assets calculated using a discounted future cash flows analysis. Assets held for sale, if any, are reported at the lower of the carrying amount or fair value less cost to sell. Investments: Investments include, principally, available-for-sale securities at fair value, held-to-maturity debt securities at amortized cost, securities that are restricted for more than one year or not publicly traded at cost, and equity method investments. For the available-for-sale securities, any unrealized holding gains and losses, net of deferred taxes, are excluded from operating results and are recognized as a separate component of Finance Receivables: Finance receivables are considered impaired when management determines it is probable that the Company will be unable to collect all amounts due according to the
Fair Values of Financial Instruments: The fair values of financial instruments are determined based on quoted market prices and market interest rates as of the end of the reporting period. F-48 NOTES TO CONSOLIDATED FINANCIAL STATEMENTS MOTOROLA INC. AND SUBSIDIARIES (Dollars in millions, except as noted) Foreign Currency Translation: Many of the Company's non-U.S. operations use the respective local currencies as the functional currency. Those non-U.S. operations which do not use the local currency as the functional currency use the U.S. dollar. The effects of translating the financial position and results of operations of local currency functional operations into U.S. dollars are included in a separate component of Foreign Currency Transactions: The effects of remeasuring the non-functional currency assets or liabilities into the functional currency as well as gains and losses on hedges of existing assets or liabilities are marked-to-market, and the result is Stock Compensation Costs: The Company measures compensation cost for stock options and restricted stock using the intrinsic value-based method. Compensation cost, if any, is recorded based on the excess of the quoted market price at grant date over the amount an employee must pay to acquire the stock. The Company has evaluated the pro forma effects of using the fair value-based method of accounting and as such, net earnings (loss), basic earnings (loss) per common share and diluted earnings (loss) per common share would have been as follows:
The weighted-average fair value of options granted was $5.04, $7.18, and $15.23 for 2002, 2001 and 2000, respectively. The fair value of each option is estimated at the date of grant using a modified Black-Scholes option pricing model, with the following weighted-average assumptions for 2002, 2001 and 2000, respectively: dividend yields of 1.3%, 1.0% and 0.5%; expected volatility of 45.1%, 45.9% and 39.8%; risk-free interest rate of 3.8%, 4.5% and 6.1%; and expected lives of 5 years for each grant. Use of Estimates: The preparation of financial statements in conformity with accounting principles generally accepted in the United States of America requires management to make certain estimates and assumptions that affect the reported amounts of assets and liabilities and the disclosure of contingent assets and liabilities at the date of financial statements and the reported amounts of revenues and expenses during the reporting period. Actual results could differ from those estimates. Reclassifications: Certain amounts in prior years' financial statements and related notes have been reclassified to conform to the Recent Accounting Pronouncements: In
2. Other Financial Data Statement of Operations Information Other Charges Other charges (income) included in operating earnings (loss) consist of the following:
MOTOROLA INC. AND SUBSIDIARIES (Dollars in millions, except as noted) NOTES TO CONSOLIDATED FINANCIAL STATEMENTS F-49 Other Income (Expense) The following table displays the
Earnings (Loss) Per Common Share The following table presents the computation of the basic and diluted earnings (loss) per common share:
In the computation of diluted loss per common share for the
Balance Sheet Information Accounts Receivable Accounts receivable, net,
Inventories Inventories, net, consist of the following:
Property, Plant, and Equipment Property, plant and equipment, net, consists of the following:
For the years ended December 31, 2002, 2001 and 2000, the Company recorded impairment charges of $1.4 billion, $847 million, and $344 million, F-50 NOTES TO CONSOLIDATED FINANCIAL STATEMENTS MOTOROLA INC. AND SUBSIDIARIES (Dollars in millions, except as noted) segments. The charges in 2000 are primarily for discontinuation of certain wafer manufacturing technologies in the Semiconductor Products segment. Depreciation expense for the years ended December 31, 2002, 2001 Investments Investments consist of the following:
The Company Gains on sales of investments and businesses, consists of the following:
For the year ended December 31, 2001, the
transactions represented economic hedges, which did not qualify as hedges for accounting purposes under SFAS 133 and, accordingly, market fluctuations were reflected in the Company's consolidated statements of operations. For the year ended December 31, 2001, the Company recorded a total cost of the monetization of the Telefonica shares of $131 million which is reflected in the gain on sale. For the year ended December 31, 2000, the gains resulted primarily from the Company's sale of shares in Broadcom Corporation, the sale and exchange of its shares in Clearnet Communications Inc. for shares in Telus Corporation, and the sales of its investments in cellular telephone operating companies in Egypt and Chile. Other Assets Other
Included in the Other portion of Other Assets are notes receivable relating to the sale of investments in cellular operating companies in 2000. The gross receivables at December 31, 2002 and 2001 were $97 million and $107 million, respectively, with reserves of $57 million and $41 million, respectively. At December 31, 2002, $55 million of these notes receivable were in default. In January 2003 the Company received a payment of $41 million relating to these notes. MOTOROLA INC. AND SUBSIDIARIES (Dollars in millions, except as noted) NOTES TO CONSOLIDATED FINANCIAL STATEMENTS F-51 Accrued Liabilities Accrued
Stockholders' Equity Information Warrants For the years ended December 31, 2002, 2001 and 2000, proceeds from the exercise of stock warrants were $167 million (20 million shares), $127 million (15 million shares) and $95 million (11 million shares), respectively. At December 31, 2002, there were no outstanding warrants. Comprehensive Earnings (Loss) The net unrealized gains (losses) on securities included in
3. Debt and Credit Facilities Long-term debt
Short-term debt
At December 31, 2002, the outstanding zero coupon notes due 2009, referred to as Liquid Yield Option™ Notes (LYONs™), had a face value at maturity and net carrying value of $27 million and $19 million, respectively. The 2009 LYONs were originally priced at a 6% yield to maturity and are convertible into 54.804 shares of the Company's common stock for each $1,000 note. The Company can redeem F-52 NOTES TO CONSOLIDATED FINANCIAL STATEMENTS MOTOROLA INC. AND SUBSIDIARIES (Dollars in millions, except as noted)
At December 31, 2002, the LYONs due 2013 had a face value at maturity and net carrying value of $103 million and $81 million, respectively. The 2013 LYONs were originally priced at a 2.25% yield to maturity and are convertible into 33.534 shares of the Company's common stock for each $1,000 note. The Company can redeem these notes at any time at their accreted values. In addition, on September 27, 2003, and September 27, 2008, the Company will become obligated, at the election of the holders thereof, to purchase those notes for which written notice requesting redemption has been received. Purchase prices are $799.52 and $894.16 per $1,000 principal amount at September 27, 2003, and September 27, 2008, respectively. On December 17, 2002, the Company entered into a contract with Goldman, Sachs & Co. (Goldman) to fully retire the Company's $825 million of Puttable Reset Securities PURSSM due February 1, 2011. Under the terms of the agreement, Goldman agreed to sell the PURS to the Company on February 3, 2003 for their $825 million stated principal amount. Goldman acquired the PURS under its pre-existing call option, which was exercised by Goldman in late November 2002. Absent the agreement, beginning on February 1, 2003 and annually thereafter until maturity, the interest rate on the PURS was to be reset and the PURS were to be remarketed by Goldman. Under the agreement, Motorola made a payment of $106 million to Goldman to terminate Goldman's rights to remarket the PURS annually through their scheduled maturity in 2011. This charge is included in Other within Other Income (Expense) in the Company's consolidated statements of operations. In January of 2002, the Company completed the exchange of $600 million of registered 8.00% Notes due November 1, 2011 (the "Registered Notes") for $600 million of unregistered 8.00% Notes due November 1, 2011 (the Also on October 31, 2001, the Company sold $1.05 billion of 7.00% Equity Security Units (the "Units"). The Units consist of: (i) purchase contracts under which (a) the holder will purchase shares of common stock of the Company, $3 par value per share, on November 16, 2004, and (b) the Company will pay contract adjustment payments at the annual rate of .50% of the $50 per Unit face amount, and (ii) 6.50% Senior Notes due November 16, 2007 that pay interest at the annual rate of 6.50% of the $50 per Unit face
In February 1999, Motorola Capital Trust I, a Delaware statutory business trust and wholly owned subsidiary of the Company (the "Trust"), sold Trust Originated Preferred SecuritiesSM ("TOPrS") to the public at an aggregate offering price of $500 million. The Trust used the proceeds from this sale, together with the proceeds from its sale of common stock to the Company, to buy a series of 6.68% Deferrable Interest Junior Subordinated Debentures due March 31, 2039 ("Subordinated Debentures") from the Company with the same payment terms as the TOPrS. The sole assets of the Trust are the Subordinated Debentures. The TOPrS are shown as
The LYONs issues are subordinated to all existing and future senior indebtedness of the Company and rank on a parity with each other. Aggregate requirements for long-term debt maturities (assuming earliest put date) during the next five years are as follows: The Company MOTOROLA INC. AND SUBSIDIARIES (Dollars in millions, except as noted) NOTES TO CONSOLIDATED FINANCIAL STATEMENTS F-53 Company was in compliance at December 31, LYONs is a trademark of Merrill Lynch & Co., Inc. 4. Risk Management Derivative Financial Instruments Foreign Currency Risk As a multinational company, the Company's transactions are denominated in a variety of currencies. The Company uses financial instruments to hedge, and therefore attempts to reduce its overall exposure to the effects of currency fluctuations on cash flows. The Company's policy is not to speculate in financial instruments for profit on the exchange rate price fluctuation, trade in currencies for which there are no underlying exposures, or enter into trades for any currency to intentionally increase the underlying exposure. Instruments used as hedges must be effective at reducing the risk associated with the exposure being hedged and must be designated as a hedge at the inception of the contract. Accordingly, changes in market values of hedge instruments must be highly correlated with changes in market values of underlying hedged items both at inception of the hedge and over the life of the hedge contract. The Company's strategy in foreign exchange exposure issues is to offset the gains or losses of the financial instruments against losses or gains on the underlying operational cash flows or investments based on the operating business units' assessment of risk. Almost all of the Company's non-functional currency receivables and payables, which are denominated in major currencies that can be traded on open markets, are hedged. The Company uses forward contracts and options to hedge these currency exposures. In addition, the Company hedges some firmly committed transactions and some forecasted transactions. The Company expects that it may hedge investments in foreign subsidiaries in the future. A portion of the Company's exposure is from currencies At December 31,
of U.S. dollars, the five largest net foreign exchange hedge positions as of December 31,
The Company is exposed to credit-related losses if counterparties to financial instruments fail to perform their obligations. However, it does not expect any counterparties, which presently have high credit ratings, to fail to meet their obligations. Interest Rate Risk In March 2002, the Company entered into interest rate swaps to change the characteristics of interest rate payments on its $1.4 billion 6.75% debentures due 2006 and its $300 million 7.60% notes due 2007 from fixed-rate payments to short-term LIBOR based variable rate payments to manage fixed and floating rates in its debt portfolio. In June 1999, the Company's finance subsidiary entered into interest rate swaps to change the characteristics of the interest rate payments on its $500 million 6.75% F-54 NOTES TO CONSOLIDATED FINANCIAL STATEMENTS MOTOROLA INC. AND SUBSIDIARIES (Dollars in millions, except as December 31, 2002 the Company had no outstanding The Company is exposed to credit-related losses in the event of nonperformance by the counter parties to swap contracts. The Company minimizes its credit risk on these transactions by only dealing with leading, credit-worthy financial institutions having long-term debt ratings of "A" or better and, therefore, does not anticipate nonperformance. In addition, the contracts are distributed among several financial institutions, thus minimizing credit risk concentration. Stockholders' Equity Derivative instruments activity, net of tax, included in
Fair Value Hedges The Company recorded charges (income) of $2 million and $(2) million for the years ended December 31, 2002 and 2001, respectively, representing the ineffective Cash Flow Hedges The Company recorded charges (income) of $(.1) million and $9 million for the years ended December 31, 2002 and 2001, respectively, representing the ineffective During the At December 31, Net Investment in Foreign Operations Hedge At December 31, 2002 and 2001, the Company did not have any hedges of foreign currency exposure of net investments in foreign operations. However, the Company expects that it may hedge investments in foreign subsidiaries in the future. Investments Hedge Fair Value of Financial Instruments The Company's financial instruments include cash equivalents, short-term investments, accounts receivable, long-term finance receivables, accounts payable, accrued liabilities, notes payable, long-term debt, foreign currency contracts and other financing commitments. Using available market information, the Company determined that the fair value of long-term debt at December 31, The fair values of the other financial instruments were not materially different from their carrying or contract values at December 31, MOTOROLA INC. AND SUBSIDIARIES (Dollars in millions, except as noted) NOTES TO CONSOLIDATED FINANCIAL STATEMENTS F-55 5. Income Taxes Components of earnings (loss) before income taxes are as follows:
Components of income tax
Deferred tax Differences between income tax expense (benefit) computed at the U.S. federal statutory tax rate of 35% and
Significant components of deferred tax assets (liabilities) are as follows:
Gross deferred tax assets were The Internal Revenue Service (IRS) has examined the federal income tax returns for the Company through 1995 and has settled the respective returns through 1991. The IRS has proposed certain adjustments to the Company's income and tax credits for the years 1992 through 1995 that would result in additional tax. The Company disagrees with most of the proposed adjustments and is contesting them at the Appeals level of the IRS. The IRS is currently performing the field level examination of the 1996 through 2000 tax returns. In the opinion of the Company's management, the F-56 NOTES TO CONSOLIDATED FINANCIAL STATEMENTS MOTOROLA INC. AND SUBSIDIARIES (Dollars in millions, except as noted) final disposition of these matters, and proposed adjustments from other tax authorities, will not have a material adverse effect on the consolidated financial position, liquidity or results of operations of the Company. 6. Employee Benefit and Incentive Plans Pension Benefits The Company's noncontributory pension plan (the Regular Pension Plan) covers most U.S. employees who become eligible after one year of service. The benefit formula is dependent upon employee earnings and years of service. Effective January 1, 2001, the General Instrument Pension Plan was amended with benefits accumulated under that plan frozen and all participants eligible for participation in the Company's Regular Pension Plan. The Company has a noncontributory supplemental retirement benefit plan (the Officers' Plan) for its elected officers. The Officers' Plan contains provisions for funding the participants' expected retirement benefits when the participants meet the minimum age and years of service requirements. Elected officers who were not yet vested in the Officers' Plan as of December 31, 1999 had the option to remain in the Officers' Plan or elect to have their benefit bought out in restricted stock units. Effective December 31, 1999 no new elected officers were eligible to participate in the Officers' Plan. The Company has an additional noncontributory supplemental retirement benefit plan (the Motorola Supplemental Pension Plan—MSPP), which provides supplemental benefits in excess of the limitations imposed by the Internal Revenue Code on the Regular Pension The Company uses a five-year, market-related asset value method of amortizing asset-related gains and losses. Benefits under all U.S. pension plans are valued based upon the projected unit credit cost method. The assumptions used
Discount rates are established based on prevailing market rates for high-quality fixed-income instruments that, if the pension benefit obligation was settled at the measurement date, would provide the necessary future cash flows to pay the benefit obligation when due. At December 31, The net U.S. periodic pension cost for the regular pension plan, officers' plan, and Regular Pension Plan
Officers' Plan and MSPP
MOTOROLA INC. AND SUBSIDIARIES (Dollars in millions, except as noted) NOTES TO CONSOLIDATED FINANCIAL STATEMENTS F-57
Certain non-U.S. subsidiaries have varying types of retirement programs providing benefits for substantially all of their employees. Amounts charged to earnings for all non-U.S. programs were $86 million, $109 million and $85 million for the years ended December 31,
F-58 NOTES TO CONSOLIDATED FINANCIAL STATEMENTS MOTOROLA INC. AND SUBSIDIARIES (Dollars in millions, except as noted) Postretirement Health Care Benefits The assumptions used
Net retiree health care expenses were as follows:
The funded status of the plan is as follows. Plan assets are comprised primarily of equity securities, bonds and cash equivalents.
The health care trend rate used to determine the Changing the health care trend rate by one percentage point would change the accumulated postretirement benefit obligation and the net retiree health care expense as follows:
The Company has no significant postretirement health care benefit plans outside Stock Compensation Plans Employee Stock Purchase Plan The employee stock purchase plan allows eligible participants to purchase shares of the Company's common stock through payroll deductions of up to 10% of compensation on an after-tax basis. The price an employee pays per share is 85% of the lower of the fair market value of the Company's stock on the close of the first trading day or last trading day of the purchase period. The plan has two purchase periods, the first one from October 1 through March 31 and the second one from April 1 through September 30. For the years ended December 31, 2002, 2001 and 2000, employees purchased 16.1 million, 16.0 million and 7.7 million shares, respectively, at prices ranging from $8.65 to $12.07, $12.12 to $12.50 and $24.01 to $25.23, respectively. Stock Options Under the Company's stock option plans, options to acquire shares of common stock have been made available for grant to certain employees, non-employee directors and to existing option holders in connection with the merging of option plans following an acquisition. Each option granted has an exercise price of 100% of the market value of the common stock on the date of grant. The majority of the options have a contractual life of Upon the occurrence of a change in control, each stock option outstanding on the date on which the change in control occurs will immediately become exercisable in full. In addition, the restrictions on all shares of restricted stock and restricted stock units outstanding on the date on which the change in control occurs will
MOTOROLA INC. AND SUBSIDIARIES (Dollars in millions, except as noted) NOTES TO CONSOLIDATED FINANCIAL STATEMENTS F-59
Stock options activity was as
The following table summarizes information about stock options outstanding and exercisable at December 31,
| |||||||||||||||||||||||||||||||||||||||||||||||||||||||||||||||||||||||||||||||||||||||||||||||||||||||||||||||||||||||||||||||||||||||||||||||||||||||||||||||||||||||||||||||||||||||||||||||||||||||||||||||||||||||||||||||||||||||||||||||||||||||||||||||||||||||||||||||||||||||||||||||||||||||||||||||||||||||||||||||||||||||||||||||||||||||||||||||||||||||||||||||||||||||||||||||||||||||||||||||||||||||||||||||||||||||||||||||||||||||||||||||||||||||||||||||||||||||||||||||||||||||||||||||||||||||||||||||||||||||||||||||||||||||||||||||||||||||||||||||||||||||||||||||||||||||||||||||||||||||||||||||||||||||||||||||||||||||||||||||||||||||||||||||||||||||||||||||||||||||||||||||||||||||||||||||||||||||||||||||||||||||||||||||||||||||||||||||||||||||||||||||||||||||||||||||||||||||||||||||||||||||||||||||||||||||||||||||||||||||||||||||||||||||||||||||||||||||||||||||||||||||||||||||||||||||||||||||||||||||||||||||||||||||||||||||||||||||||||||||||||||||||||||||||||||||||||||||||||||
|---|---|---|---|---|---|---|---|---|---|---|---|---|---|---|---|---|---|---|---|---|---|---|---|---|---|---|---|---|---|---|---|---|---|---|---|---|---|---|---|---|---|---|---|---|---|---|---|---|---|---|---|---|---|---|---|---|---|---|---|---|---|---|---|---|---|---|---|---|---|---|---|---|---|---|---|---|---|---|---|---|---|---|---|---|---|---|---|---|---|---|---|---|---|---|---|---|---|---|---|---|---|---|---|---|---|---|---|---|---|---|---|---|---|---|---|---|---|---|---|---|---|---|---|---|---|---|---|---|---|---|---|---|---|---|---|---|---|---|---|---|---|---|---|---|---|---|---|---|---|---|---|---|---|---|---|---|---|---|---|---|---|---|---|---|---|---|---|---|---|---|---|---|---|---|---|---|---|---|---|---|---|---|---|---|---|---|---|---|---|---|---|---|---|---|---|---|---|---|---|---|---|---|---|---|---|---|---|---|---|---|---|---|---|---|---|---|---|---|---|---|---|---|---|---|---|---|---|---|---|---|---|---|---|---|---|---|---|---|---|---|---|---|---|---|---|---|---|---|---|---|---|---|---|---|---|---|---|---|---|---|---|---|---|---|---|---|---|---|---|---|---|---|---|---|---|---|---|---|---|---|---|---|---|---|---|---|---|---|---|---|---|---|---|---|---|---|---|---|---|---|---|---|---|---|---|---|---|---|---|---|---|---|---|---|---|---|---|---|---|---|---|---|---|---|---|---|---|---|---|---|---|---|---|---|---|---|---|---|---|---|---|---|---|---|---|---|---|---|---|---|---|---|---|---|---|---|---|---|---|---|---|---|---|---|---|---|---|---|---|---|---|---|---|---|---|---|---|---|---|---|---|---|---|---|---|---|---|---|---|---|---|---|---|---|---|---|---|---|---|---|---|---|---|---|---|---|---|---|---|---|---|---|---|---|---|---|---|---|---|---|---|---|---|---|---|---|---|---|---|---|---|---|---|---|---|---|---|---|---|---|---|---|---|---|---|---|---|---|---|---|---|---|---|---|---|---|---|---|---|---|---|---|---|---|---|---|---|---|---|---|---|---|---|---|---|---|---|---|---|---|---|---|---|---|---|---|---|---|---|---|---|---|---|---|---|---|---|---|---|---|---|---|---|---|---|---|---|---|---|---|---|---|---|---|---|---|---|---|---|---|---|---|---|---|---|---|---|---|---|---|---|---|---|---|---|---|---|---|---|---|---|---|---|---|---|---|---|---|---|---|---|---|---|---|---|---|---|---|---|---|---|---|---|---|---|---|---|---|---|---|---|---|---|---|---|---|---|---|---|---|---|---|---|---|---|---|---|---|---|---|---|---|---|---|---|---|---|---|---|---|---|---|---|---|---|---|---|---|---|---|---|---|---|---|---|---|---|---|---|---|---|---|---|---|---|---|---|---|---|---|---|---|---|---|---|---|---|---|---|---|---|---|---|---|---|---|---|---|---|---|---|---|---|---|---|---|---|---|---|---|---|---|---|---|---|---|---|---|---|---|---|---|---|---|---|---|---|---|---|---|---|---|---|---|---|---|---|---|---|---|---|---|---|---|---|---|---|---|---|---|---|---|---|---|---|---|---|---|---|---|---|---|---|---|---|---|---|---|---|---|---|---|---|---|---|---|---|---|---|---|---|---|---|---|---|---|---|---|---|---|---|---|---|---|---|---|---|---|---|---|---|---|---|---|---|---|---|---|---|---|---|---|---|---|---|---|---|---|---|---|---|---|---|---|---|---|---|---|---|---|---|---|---|---|---|---|---|---|---|---|---|---|---|---|---|---|---|---|---|---|---|---|---|---|---|---|---|---|---|---|---|---|---|---|---|---|---|---|---|---|---|---|---|---|---|---|---|---|---|---|---|---|---|---|---|---|---|---|---|---|---|---|---|---|---|---|---|---|---|---|---|---|---|---|---|---|---|---|---|---|---|---|---|---|---|---|---|---|---|---|---|---|---|---|---|---|---|---|---|---|---|---|---|---|---|---|---|---|---|---|---|---|---|---|---|---|---|---|---|---|---|---|---|---|---|---|---|---|---|---|---|---|---|---|---|---|---|---|---|---|---|---|---|---|---|---|---|---|---|---|---|---|---|---|---|---|---|---|---|---|---|---|---|---|---|---|---|---|---|---|---|---|---|---|---|---|---|---|---|---|---|---|---|---|---|---|---|---|---|---|---|---|---|---|---|---|---|---|---|---|---|---|---|---|---|---|---|---|---|---|---|---|---|---|---|---|---|---|---|